
29
Sep
Abstract
The non-GSO satellite industry continues to expand rapidly with new innovative uses of low Earth orbit (LEO). Constellations of satellites are being developed to provide a range of services, including direct to device (D2D), broadband communications, remote sensing and positioning, navigation and timing (PNT) services. Developing these systems requires detailed analysis to optimise the service and take the decisions needed to go from idea to operation. All these studies can be undertaken using the Visualyse range of tools, all the way from constellation design to coordination and licensing and hence bringing into use, as described in this paper.
Overview of Process
Development of a non-GSO system from idea to bringing into use (BIU) involves a number of steps, as shown in the figure below:

Many of these steps require detailed analysis and simulation including:
- System design: this requires constellation analysis such as coverage and visibility, frequency band selection, link budget analysis, capacity and throughput analysis and potentially equivalent power flux density (EPFD) analysis
- Develop filing: this can require generation of power flux density (PFD) masks for those filings requiring an EPFD examination under Article 22 including Resolution 770 analysis under Article 22.5L
- Coordination of satellite network with other administrations: this can require detailed simulations of the non-GSO constellations to identify ways that facilitate sharing.
- Earth station coordination and licensing can involve detailed technical analysis.
This paper describes how the Visualyse range of tools can support this process, including in particular the constellation design and coordination stages. Using a single tool such as Visualyse brings a number of benefits:
- A small set of tools can provide the full range of functionality required to go from non-GSO satellite constellation design to coordination and licensing
- Many of the stages in a non-GSO constellation’s development process can be undertaken using a single tool which can reduce the training requirements
- Simulation files created for one task can be re-used for other tasks
- There is consistency in the analysis across the development process.
Constellation Design
The constellation design process can require iteration to create the final configuration. This process can include:
- Analysis of the visibility and coverage of a constellation
- Frequency band analysis
- Link budget design
- EPFD analysis.
These are described further below.
Visibility and Coverage Analysis
The first stage is typically to undertake coverage analysis of a proposed non-GSO constellation for the target service area(s). This identifies metrics such as:
- Number of satellites available to provide a service over the service area
- Lowest elevation angle of highest (or second highest) elevation satellite over a time period such as a day
- Number of satellites providing a service to a given region or country (minimum, maximum, average)
- Number of beams per satellite required to provide a given level of service.
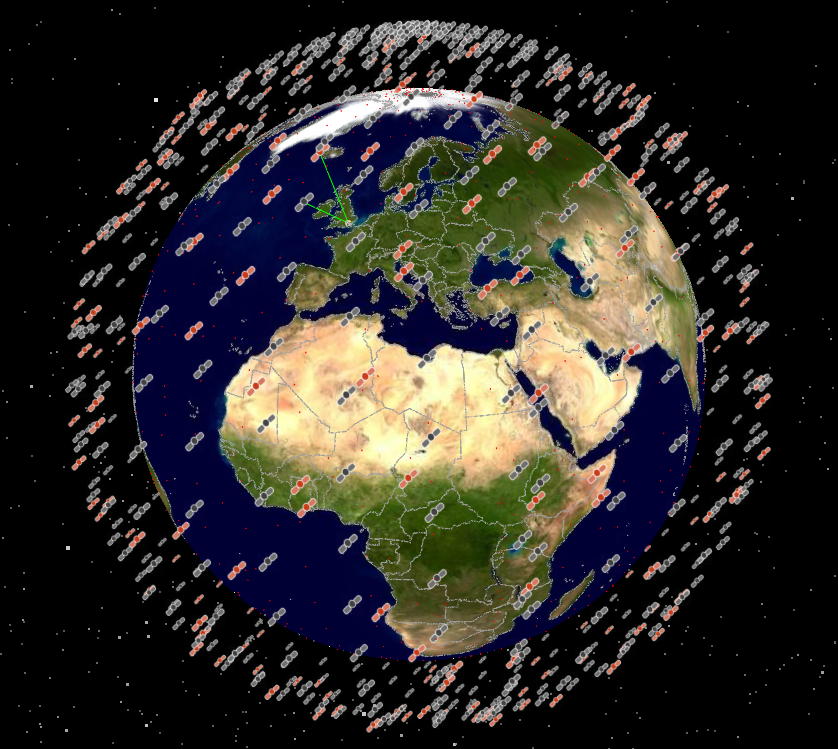
The constellation below was used to undertake an example coverage analysis:
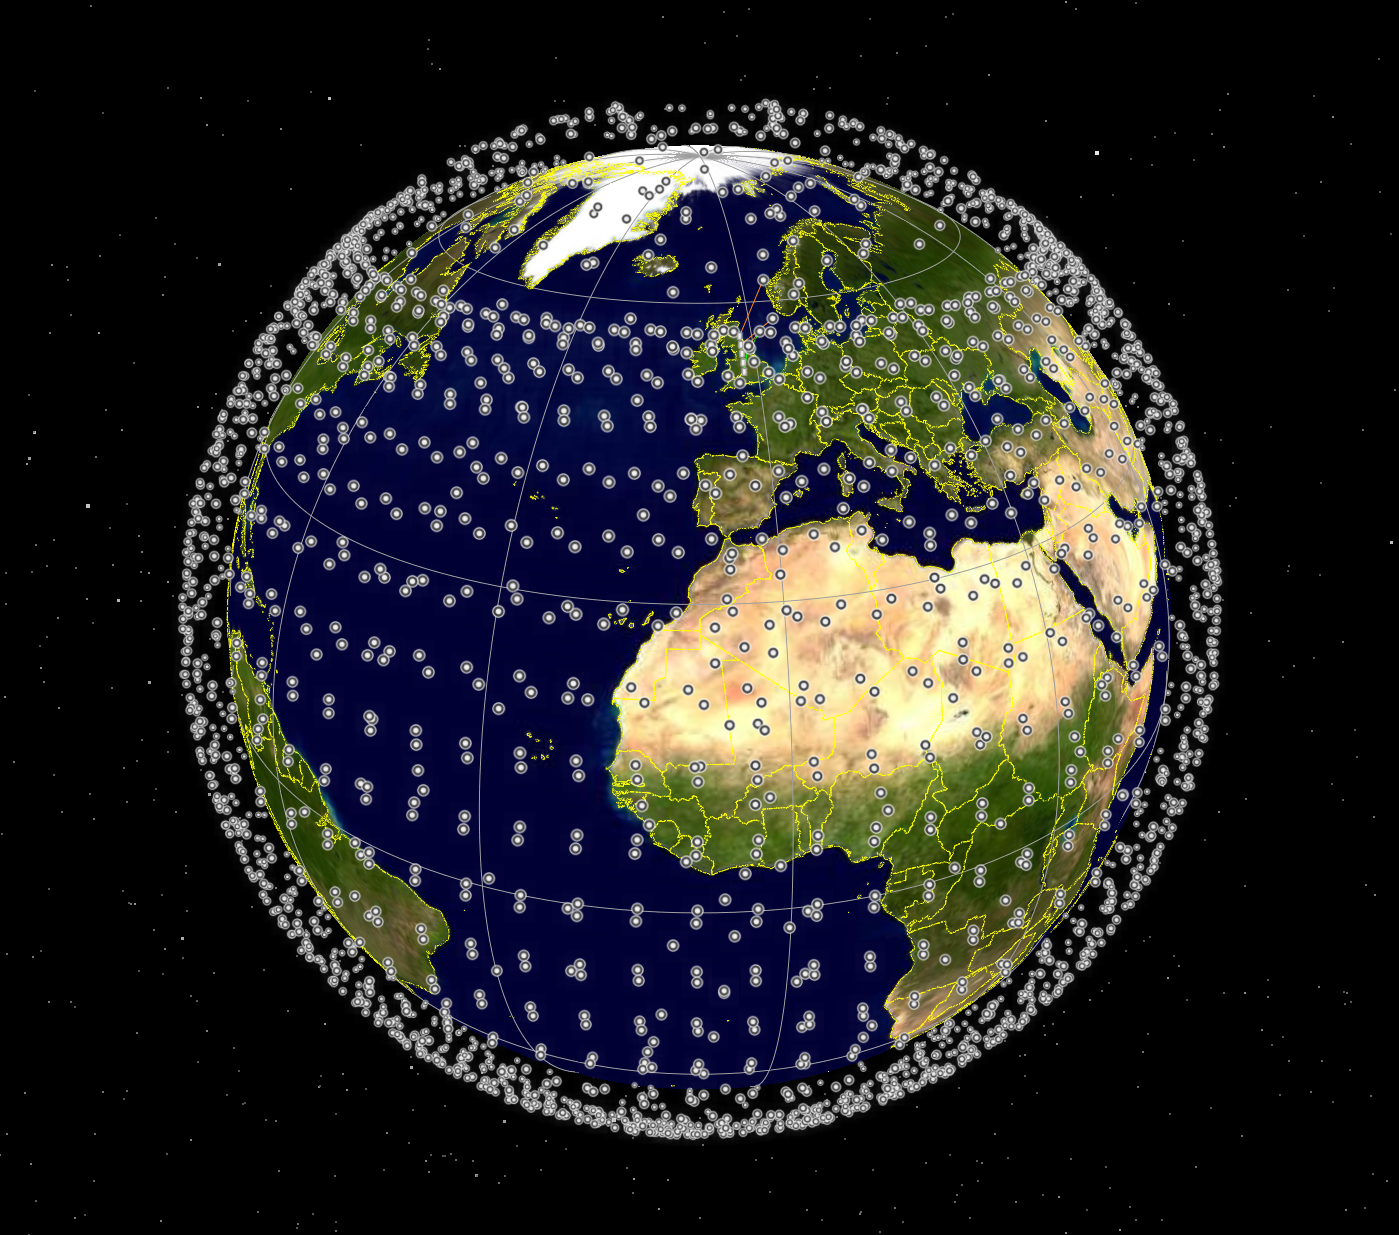
This constellation contains over 4,400 satellites at an altitude between 550 and 570 km, most at an inclination angle of around 53 degrees but with some polar planes.
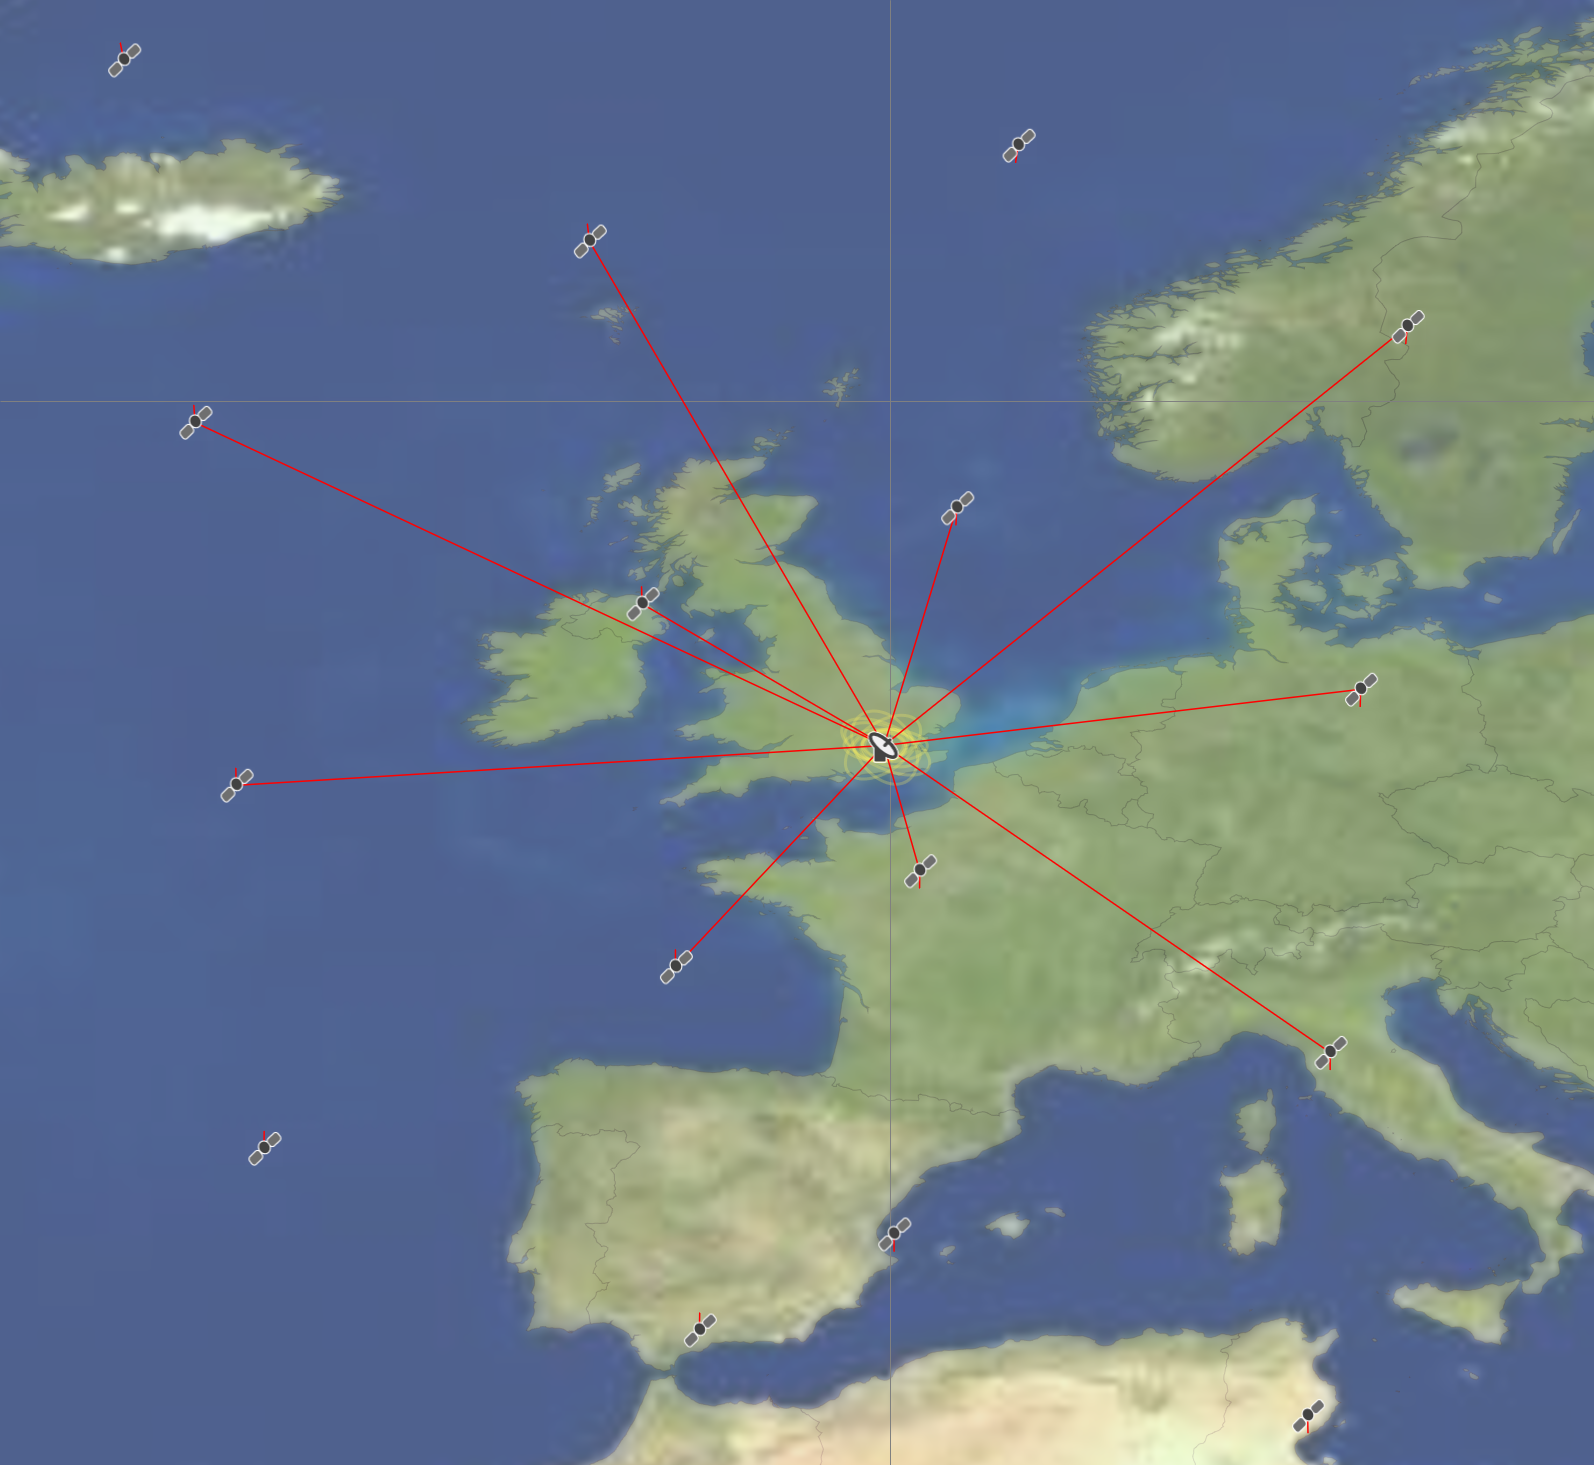
Consider a set of test points in the UK, around the boundary of the inclination angle of the majority of the satellites:
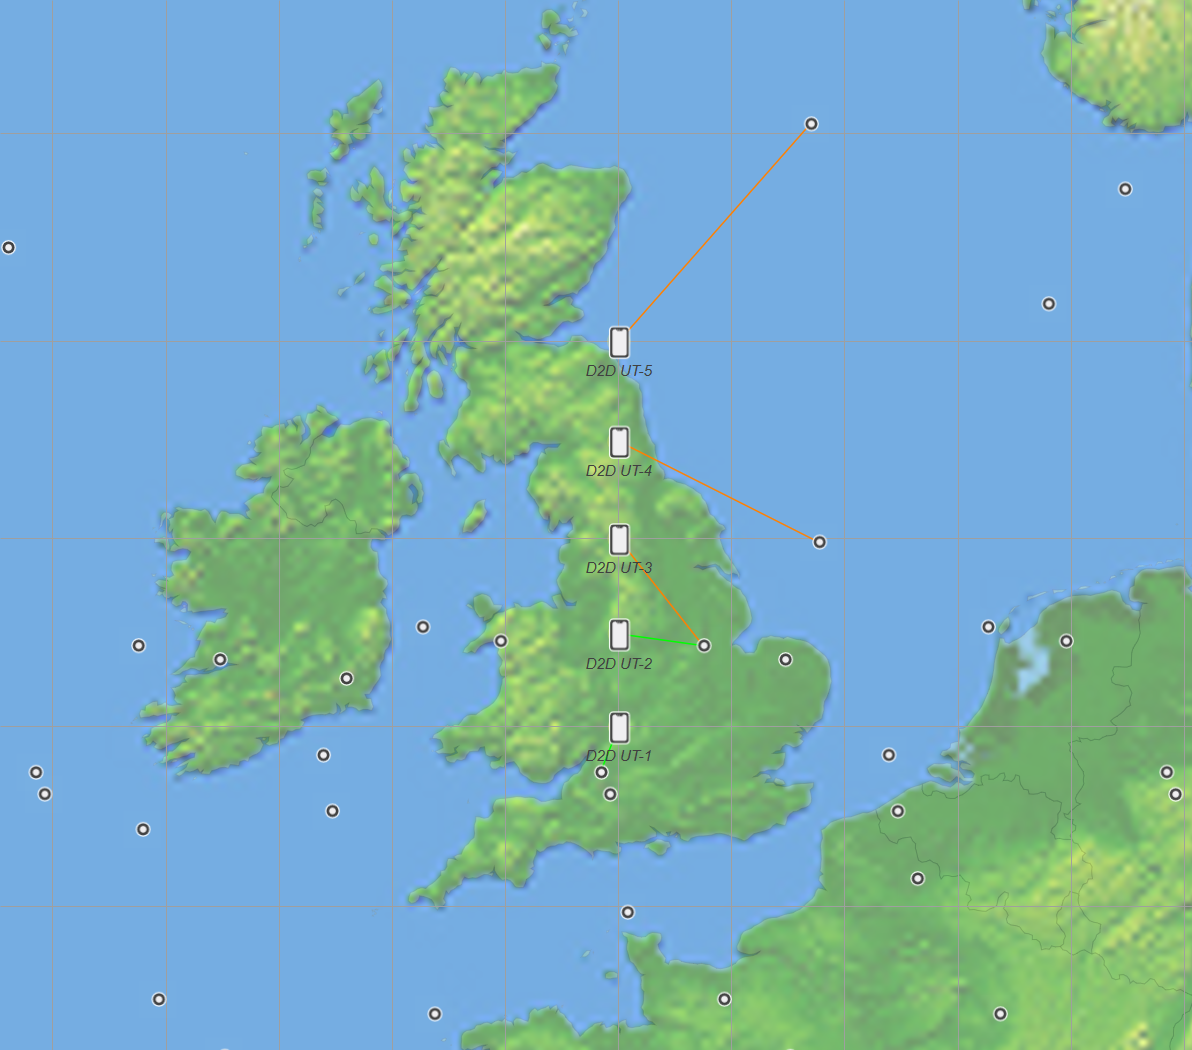
At these test locations, it is possible to calculate the number of satellites above a minimum elevation angle and then the minimum elevation angle used if the user equipment (UE) were to select the highest available satellite at each time step.
For D2D to UEs, it is useful to have as short a path length as possible, which means as high as possible an elevation angle, so a minimum elevation angle of 50° was used to generate the statistics in the table below:
| D2D UE No. | D2D UE Latitude | Lowest number of available satellites | Minimum highest elevation angle used |
|---|---|---|---|
| 1 | 52°N | 10 | 75.8° |
| 2 | 53°N | 8 | 76.3° |
| 3 | 54°N | 6 | 68.9° |
| 4 | 55°N | 4 | 61.2° |
| 5 | 56°N | 1 | 53.2° |
It can be seen that the best coverage is at around 52°N and 53°N, which is the inclination angle of the majority of the satellites of the constellation, but there is a significant reduction for higher latitudes.
This type of analysis can be extended to compare different constellation configurations and an extended range of metrics over a wider area.
More information on this study is available here with an additional example available here.
Frequency Band Analysis
One of the hot topics in the D2D community is the trade-off between operating in frequency bands allocated to the mobile service (MS) and those allocated to the mobile satellite service (MSS). Issues to consider include bandwidth available, compatibility with handsets and interference management.
An example of interference management is the potential for interference between a D2D constellation and terrestrial mobile network. This could lead to co-frequency spectrum sharing, as in the figure below:

We’ll consider this scenario assuming frequency division duplex (FDD) with both systems operating in the same direction, so that the base station (BS) is transmitting on the same frequency as the satellite downlink (DL) and the two UEs are transmitting on the same frequency in the uplink (UL) direction.
There are then a number of interference paths to consider:
| Uplink: | 1a. From D2D UE into terrestrial BS | (terrestrial path) |
| 1b. From terrestrial UE into D2D satellite | (Earth-to-space path) | |
| Downlink: | 2a. From D2D satellite into terrestrial UE | (space-to-Earth path) |
| 2b. From terrestrial BS into D2D UE | (terrestrial path) |
These interference paths were analysed in a paper available here.
In general, most of the interference paths showed manageable levels of interference. However, the uplink interference path from the terrestrial UEs to the D2D satellite showed there could be significant interference, as in the figure below:
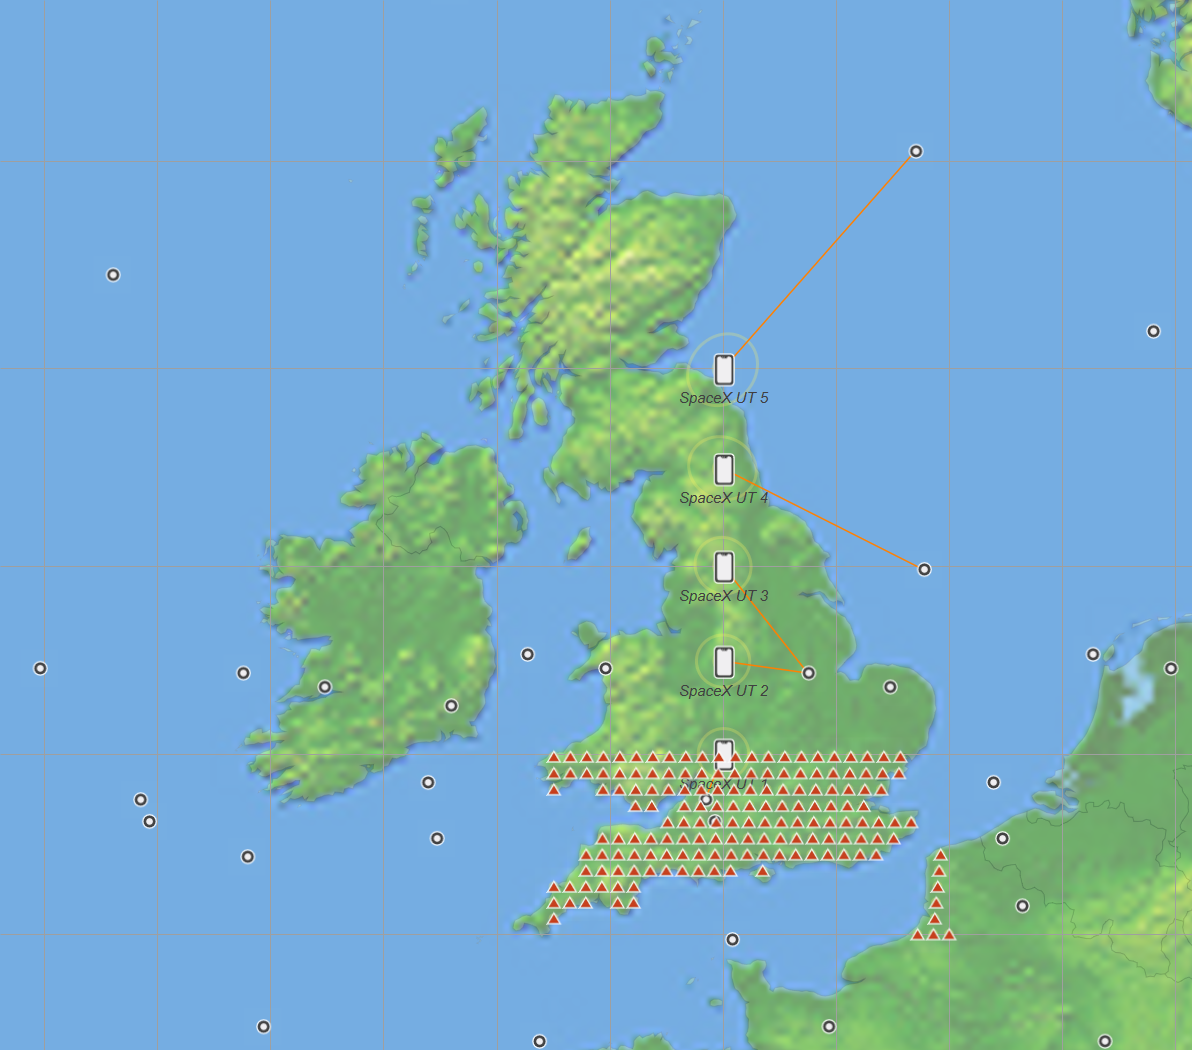
Here, the Visualyse service area wizard has been used to deploy a grid of 162 stations with separation 20 km across the land mass of England and Wales south of the lowest latitude D2D UE. Each test station then represents all the actual UEs within a 20x20 = 400km2 area. Assuming 1,000 UEs within that area, the transmit power is increased by 30 dB. Assuming a power control adjustment factor of -3 dB, the aggregate EIRP per test station was set to 20 dBW. The propagation models were enhanced by use of the Recommendation ITU-R P.2108-1 Earth to space clutter model.Note the updates to this Recommendation including the directional gain extension will be released shortly.
The resulting I/Ns are shown in the figure below.
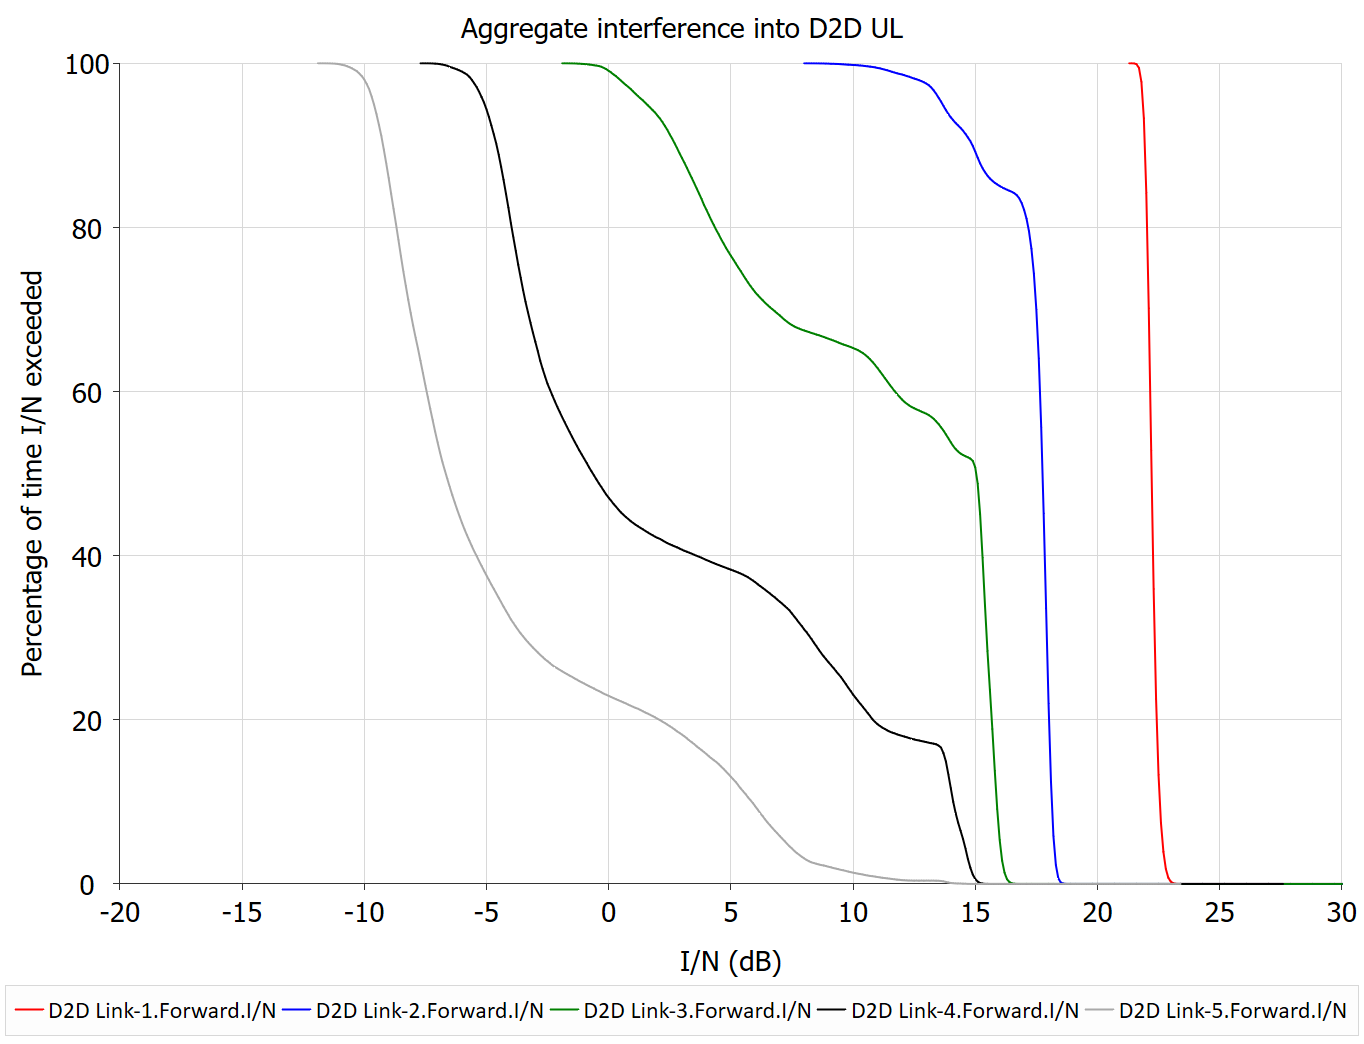
It can be seen that the I/Ns are very high, in particular for those UEs close to the widespread mobile deployment. For this reason, there could be benefits in considering D2D systems operating in MSS rather than MS spectrum.
Similar analysis could be required for non-GSO constellations providing broadband services, where there are a range of regulatory regimes that could be considered:
- Ku: EPFD limits
- Ka: Article 22 Table 22.1B EPFD limits
- Ka: Coordination bands
- Ka: Article 22 Table 22.1C EPFD limits
- Q/V band: Resolution 770
- E band: AI 1.10 bands.
Each band has advantages and disadvantages that would have to be considered and analysed.
Link Budget Analysis
For a given set of frequency bands and constellation design, the next stage is to analyse the service that can be provided in terms of metrics like availability, throughput, capacity etc. This can be undertaken using the Visualyse tools. The example system above was analysed to determine the UL and DL C/Ns using the following parameters:
| Direction | UL | DL |
|---|---|---|
| Frequency (MHz) | 1900 | 2100 |
| Bandwidth (MHz) | 5 | 20 |
| Tx power (dBW) | -8 | 10 |
| Tx peak gain (dBi) | -3 | 31.1 |
| Tx gain pattern | Isotropic | M.2101 |
| Rx peak gain (dBi) | 31.1 | -3 |
| Rx gain pattern | M.2101 | Isotropic |
| Rx noise (K) | 300 | 1500 |
| Tr(C/N) (dB) | 2.5 | 2.5 |
For these link parameters and the constellation described in previous sections, the C/Ns for the UL and DL at an array of UEs at latitudes = {52°N, 53°N, 54°N, 55°N, 56°N } were generated as in the following figures for one simulated day with a time step of 1 second:
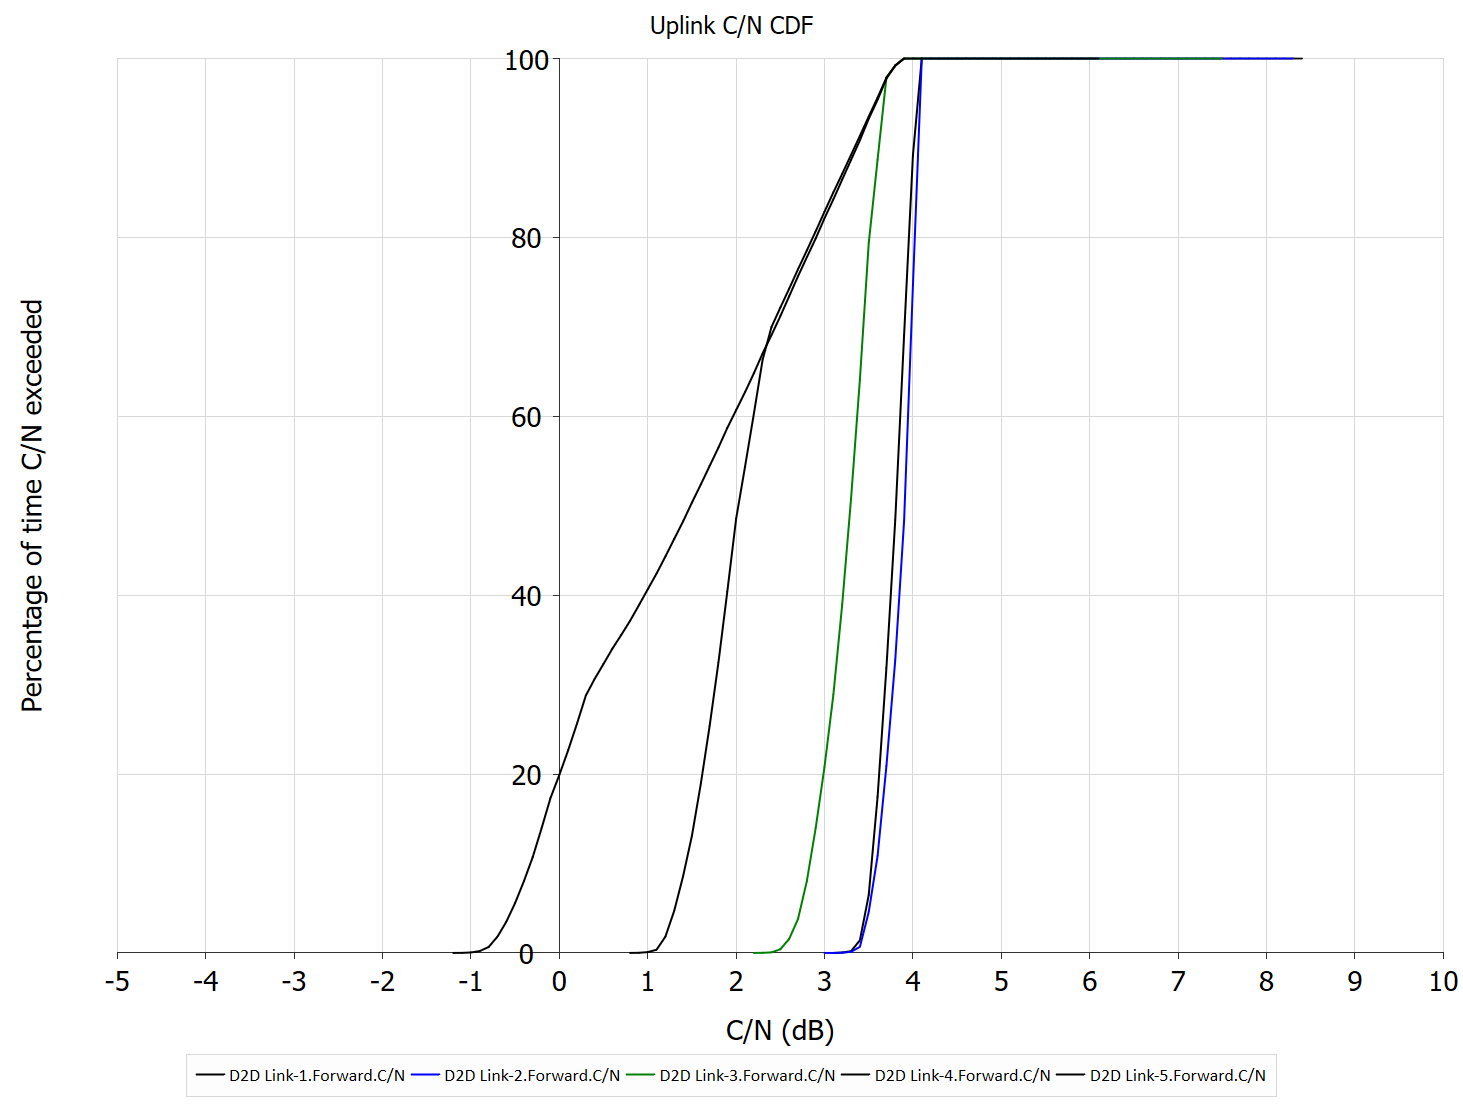
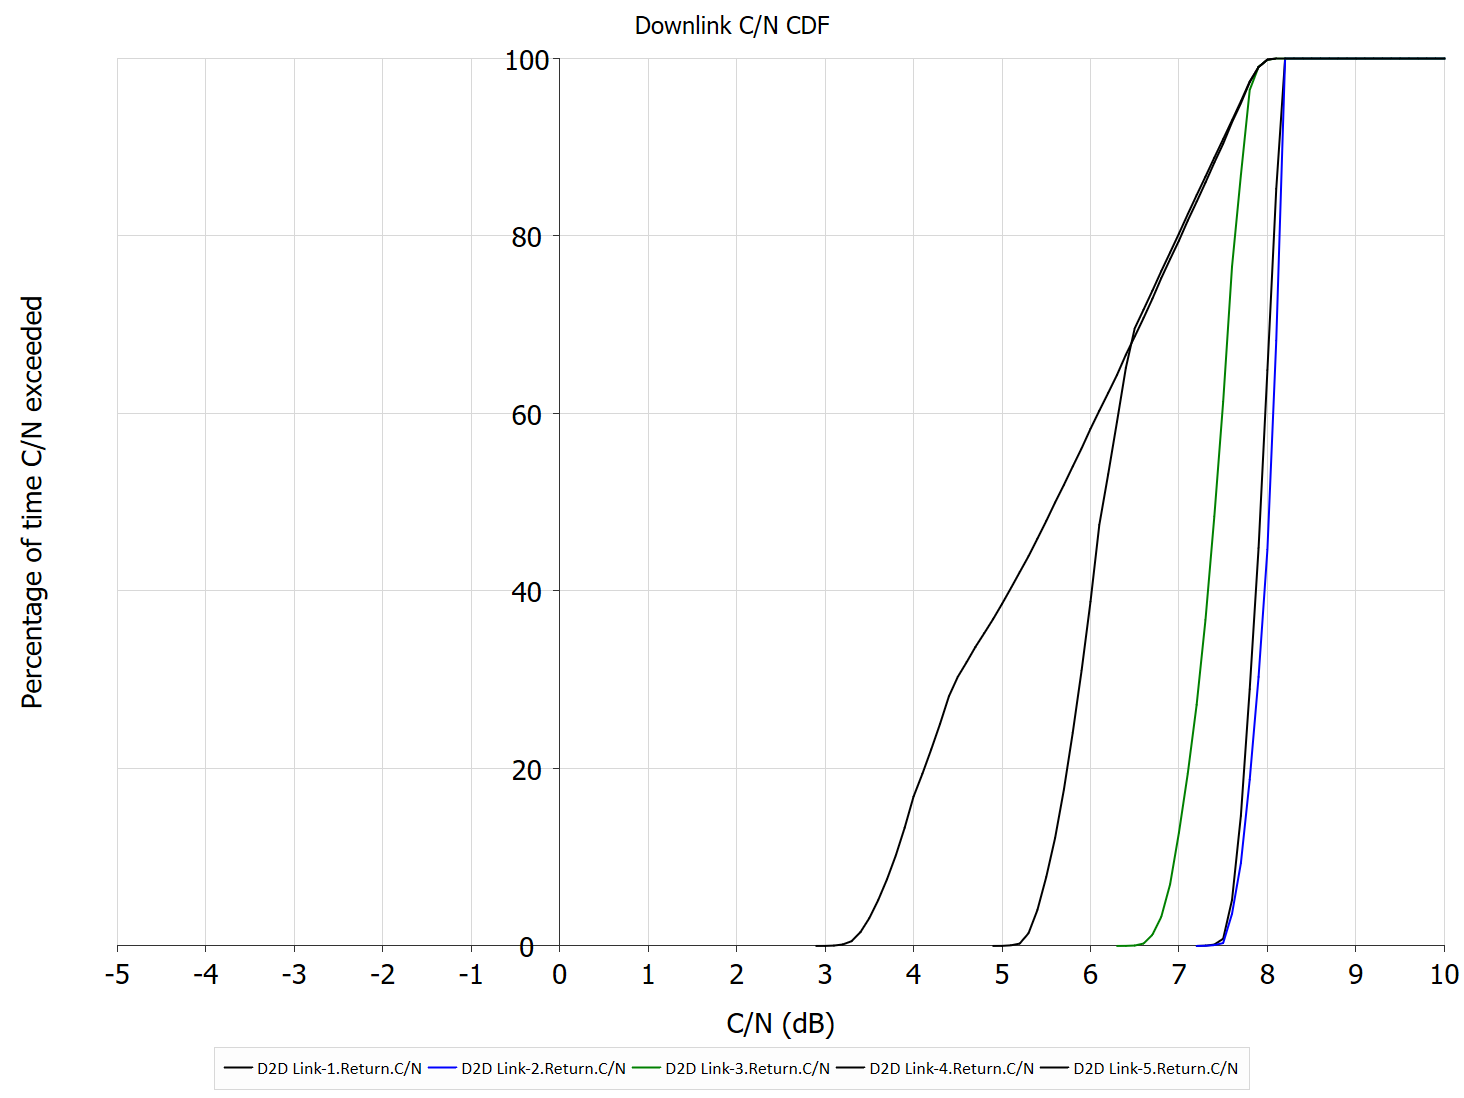
The following can be seen:
- The downlink C/Ns are generally higher than the uplink C/Ns due to the availability of higher power at the satellite, despite the downlink bandwidth being wider than that for the uplink
- The C/N CDFs are better at the lower latitudes than higher as the path lengths to the satellite are lower.
In this case, in order to provide better coverage above around 56°N, there could be benefits in adjusting the non-GSO constellation. This could be done in a number of ways:
- Reduce the satellite altitude to reduce the free space path loss to the ground
- Increase the number of satellites visible at these latitudes.
As noted earlier, the constellation design process is likely to require iteration.
More information is available in this paper and this one.
EPFD Analysis
In bands for which there are EPFD or Resolution 770 constraints, additional analysis will be required. This involves:
- Using the system characteristics to generate the input databases to a Recommendation ITU-R S.1503 examination, including the PFD mask, for example using the Visualyse PMGT, as described here
- Running the validation software to determine if the Article 22 limits are met, including the Resolution 770 thresholds in Article 22.5L., for example using the Visualyse EPFD tool
The PFD mask describes the maximum power that will be transmitted by the satellite at any time during the constellation lifetime in all directions. An example would be as in the figure below:
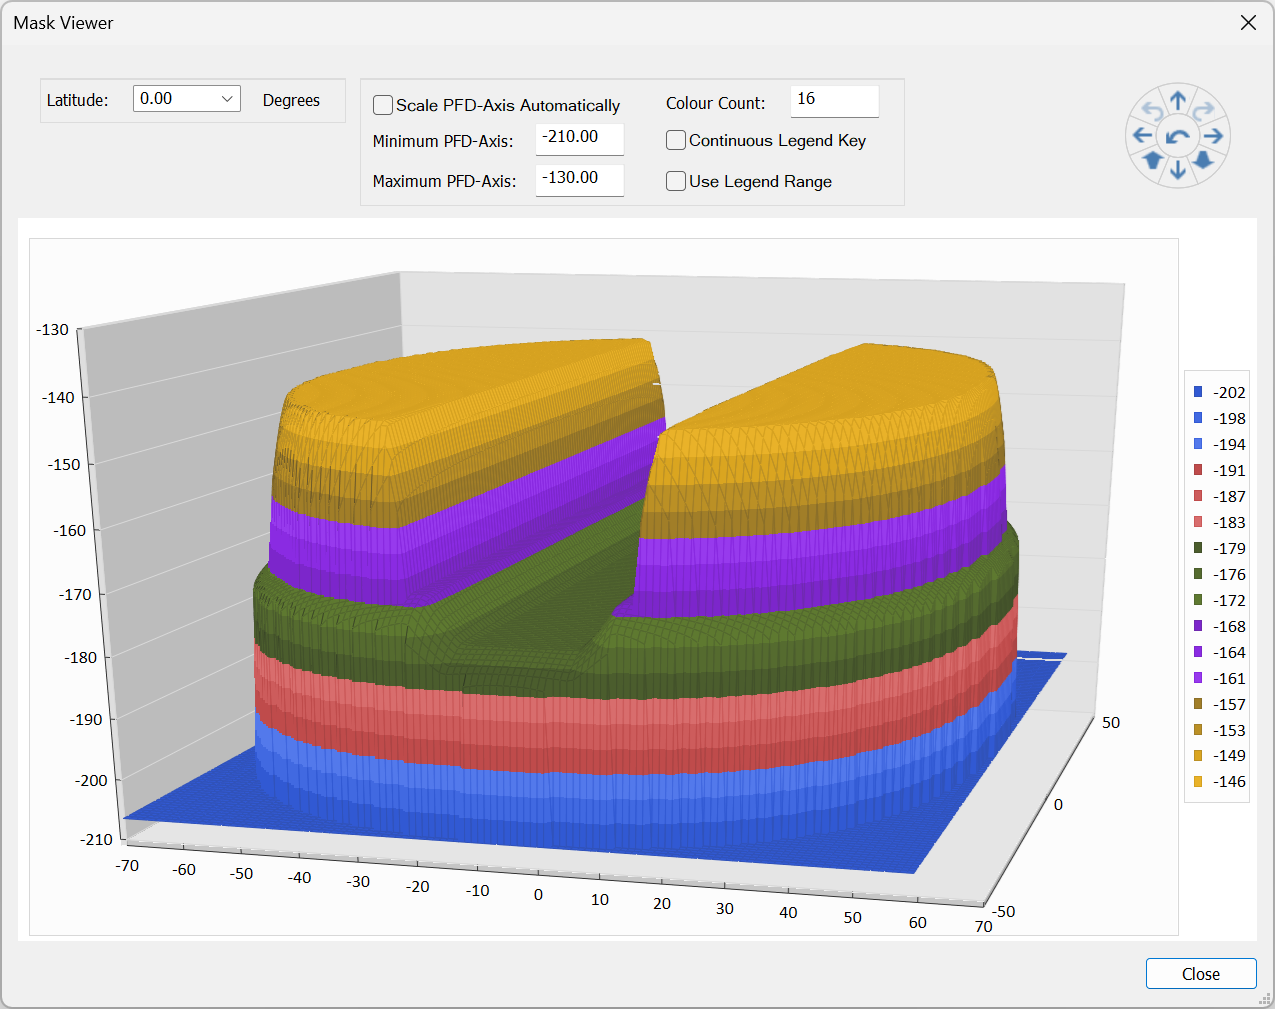
This PFD mask can then be used by Visualyse EPFD to undertake an examination of whether the non-GSO system meets the EPFD limits in Article 22 and the Resolution 770 limits for Q/V band in Article 22.5L (as described here).
An example examination is shown below:
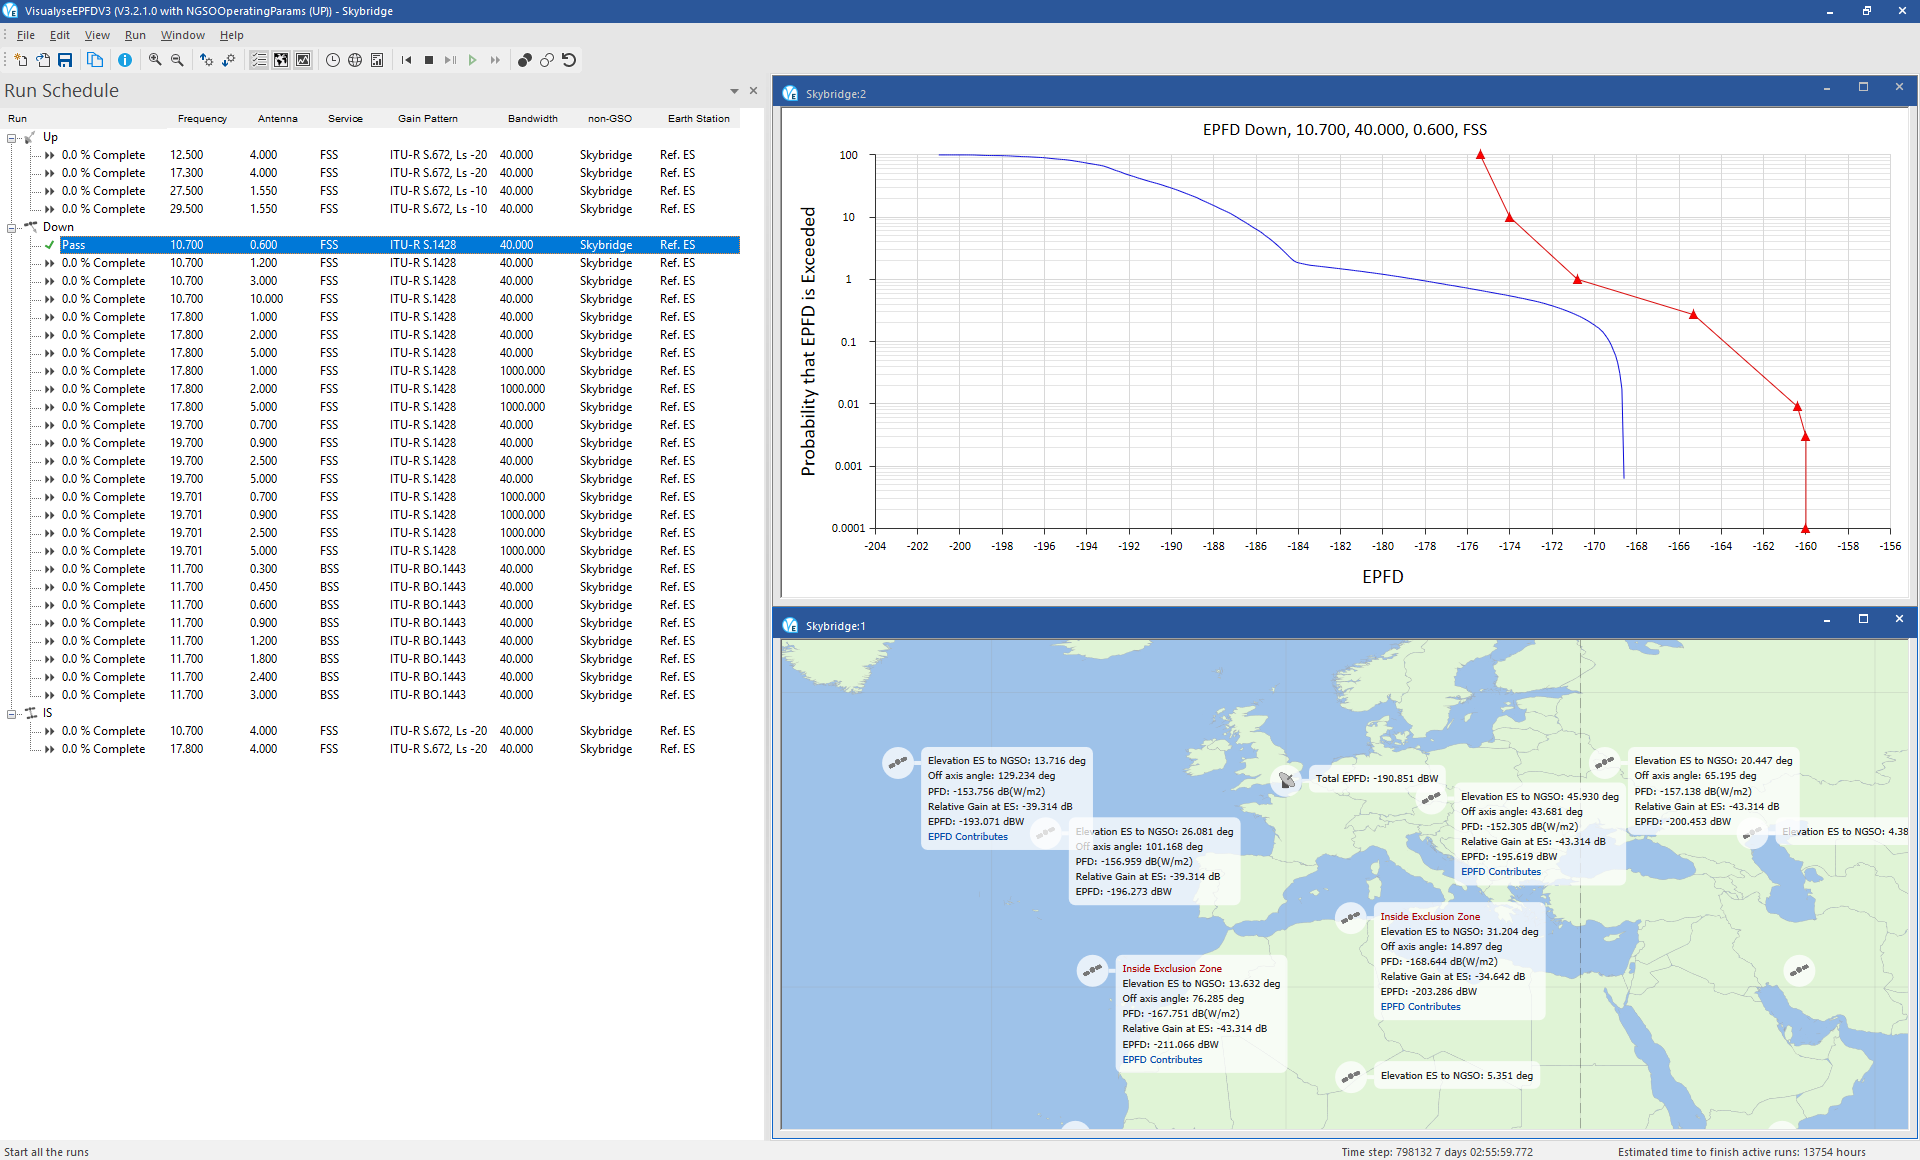
This analysis can then be used to iterate the system parameters, including constellation orbit parameters and link budgets:
- If the analysis shows the system is non-compliant: the tools can be used to identify where changes to the system are required and how large the modifications should be
- If the analysis shows the system is compliant: the tools can be used to identify if there is the potential to improve the system’s performance including capacity and throughput.
This type of analysis can also be used to identify the preferred frequency bands, as discussed above.
Creating a Filing
Visualyse tools and consultants can assist in developing a filing from creation to validation to submission. Using our in-house tools and expertise, we can support the whole process, including development of multiple filings for different services and frequency bands, and the additional databases required for an EPFD examination.
Satellite Coordination
For satellite systems, a key task within the ITU regulatory framework is that of “coordination”. This is a step that involves procedures, data bases and numerical analysis that must be undertaken to ensure a new system will not cause harmful interference into existing systems. Completing this coordination task is necessary to get regulatory approval at both a national and international level and hence can make or break satellite systems. But what is coordination and how can a non-GSO satellite operator achieve it?
In particular there are two key steps:
- Identifying where coordination is required
- Undertaking detailed coordination with another satellite operator.
These two steps can be supported by the use of software tools and we will describe two of them:
- Visualyse IFIC Checker (part of the Visualyse GSO toolset): to determine whether coordination is required
- Visualyse Professional: to undertake the simulations required as part of the detailed coordination process.
This section describes:
- The process and data that is used during the coordination process
- The coordination trigger stage
- The detailed coordination stage for constellations of satellites.
More information is available is this paper including coordination of non-GSO satellite systems involving a constellation or of one or two satellites.
Coordination Process
The ITU contains three sectors, Radiocommunication, Standardisation and Development, and the coordination process is managed under the first of these, the ITU-R and the ITU’s Radiocommunications Bureau, known as the BR. The ITUR has created a framework of regulations, most importantly the Radio Regulations (RR), a treaty level legal instrument that is updated at World Radiocommunication Conferences (WRCs). There are also associated documents such as ITUR Recommendations and the Rules of Procedure (RoP).
One of the key parts of the process is the non-GSO system’s filing. This is a technical description of the system with sufficient parameters for others to undertake an assessment of whether it could cause harmful interference into their system. Typically, this is provided in a database submitted to the ITU using the Appendix 4 format, and the date at which that database is submitted to the ITU is a key part of the process. The filing must be submitted by a national regulator, so a satellite operator must work within a country using the nation’s regulatory procedures. There is effectively a queue of filings, operating on a first-come, first served basis, so that those that arrive earlier have a degree of priority over those that are submitted later.
The ITU will check a filing against a set of criteria, such as Article 5 of the RR which allocates services to specific frequency bands. Examples of services include Mobile Satellite Service (MSS) or Earth Exploration Satellite Service (EESS). The filing must identify the service the non-GSO system intends to operate under and which frequencies it will transmit on: the ITU will then check this information against the allocations in Article 5 to make sure they are consistent, as in the figure at the start of this paper.
Having passed these initial checks, the ITU will publish the filing, allowing other organisations – administrations (i.e. countries) and satellite operators - to examine it and identify if they think that coordination is required using the criteria in Section 3.3 contained within Appendix 5 (and for other cases also in Appendix 7 and 8).
Coordination Trigger Stage
The coordination requirements depend upon the service and frequency bands the system proposes to use. These are defined in Appendix 5 of the Radio Regulations, which looks a bit like this:
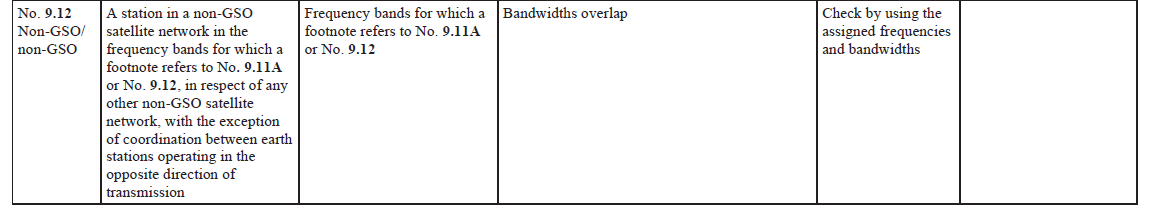
Basically, between non-GSO systems, the key trigger is bandwidth overlap: as long as there is bandwidth overlap between any of the emissions of the two filings, then coordination could be required.
While the coordination trigger requirements seem simple, they can be difficult to check because of the number of cases to consider. An IFIC can contain over a hundred filings in it and the full SRS contains over ten thousand. Furthermore, each filing can contain dozens of beams, groups, emissions, frequencies. The combination of {systems, beams, groups, emissions, frequencies, etc.} can result in millions if not billions of cases to consider.
Hence it is better to use a software tool to check all combinations automatically so that cases are not missed. An example of a software tool that can do this automatic checking of all combinations is the Visualyse IFIC Checker (part of the Visualyse GSO toolset).
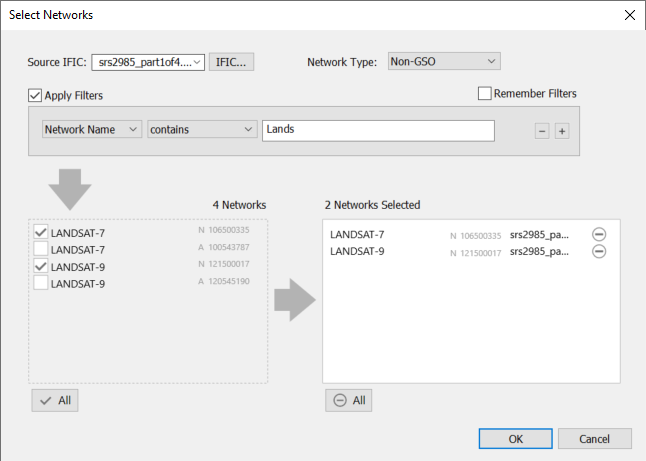
The first stage is to list the filings to be protected by either creating them using the built-in editor or importing them from an existing ITU database:
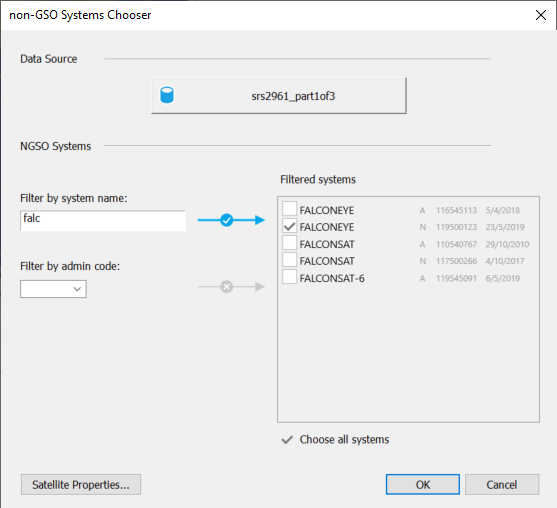
After the Visualyse IFIC Checker (part of the Visualyse GSO toolset) has been told which networks to protect, it can be used to examine an IFIC to identify which networks could require coordination. This starts the analysis:
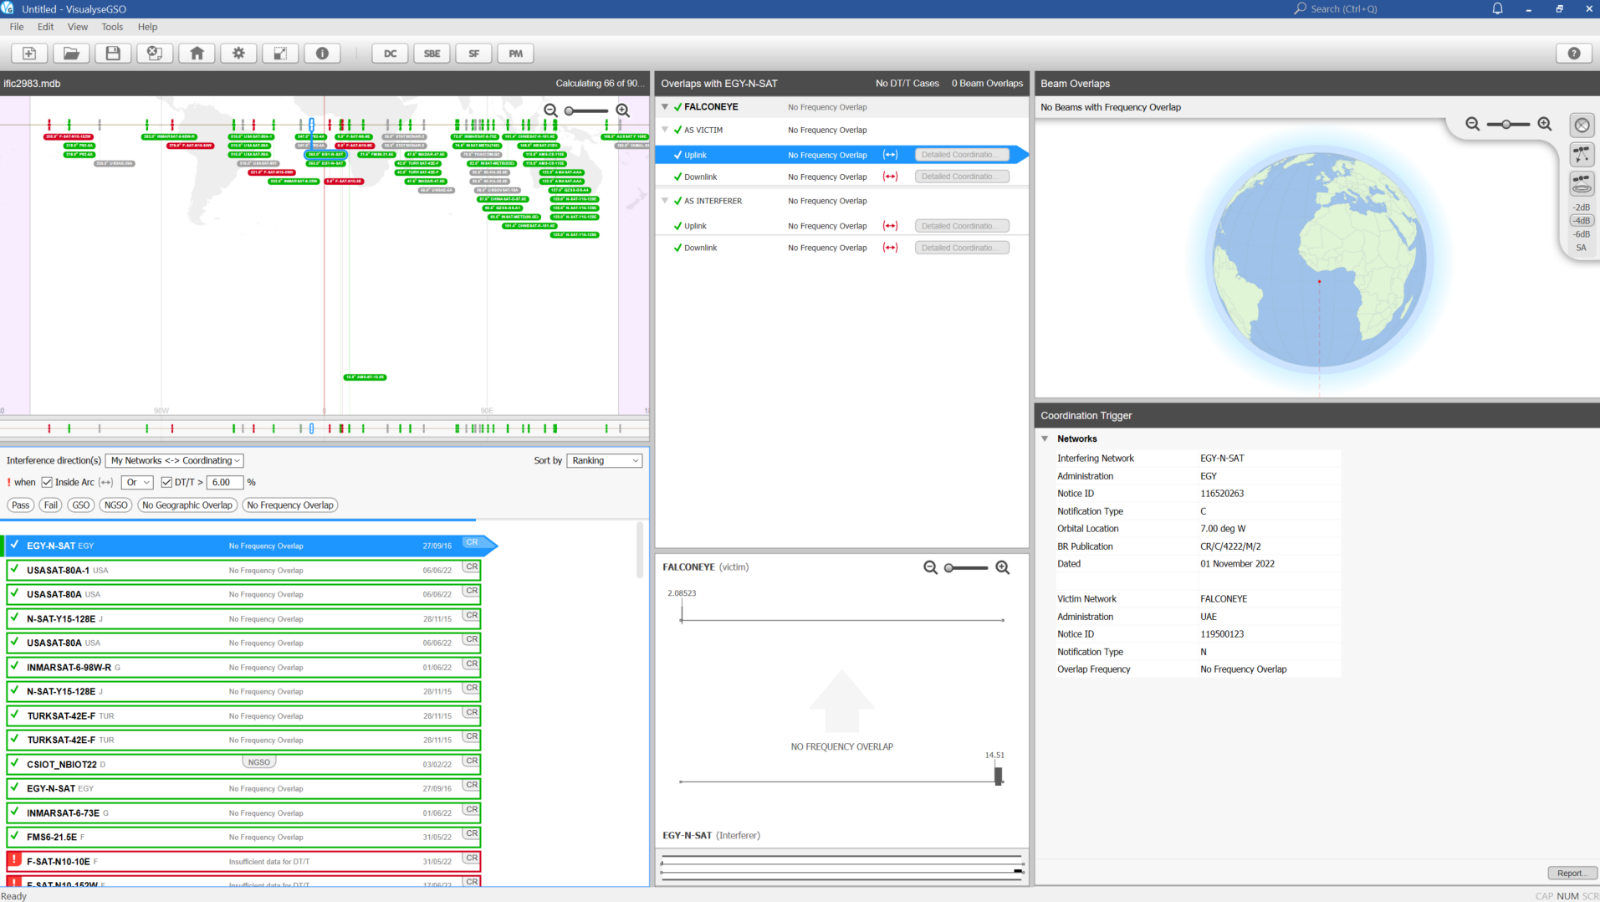
This tool identifies which networks, either GSO or non-GSO, could require coordination and provides a report that can be used to justify a request for coordination to the relevant administration and/or operator. It can also be used to check the request for coordination from other administrations and/or operators.
Just as importantly, it identifies those networks for which no further action is required – for example, if there is no frequency overlap.
The tool also generates reports that can be used to manage the coordination process and keep track of actions.
When coordination is required, it is then necessary to go into detailed coordination with another satellite operator, as described in the next section.
Detailed Coordination Analysis
The coordination trigger process is deliberately conservative in that it aims to avoid missing cases that could cause harmful interference. The aim of coordination is to:
- Undertake an assessment of whether there is a real problem of harmful interference or not
- If there is a potential for harmful interference, identify ways to mitigate it so that both systems can operate without significant degradation in the services they provide.
These two steps typically require interference analysis: building models of the two systems in simulation tools and comparing resulting metrics against suitable thresholds.
Non-GSO satellite systems are by their nature dynamic, in that the spacecraft moves and hence the interference geometry changes. Therefore, typically the analysis needs methodologies such as time dynamic, though suitable Monte Carlo methods could also be used. This type of analysis can be made quick, easy and accurate using simulation tools such as Visualyse Professional.
Visualyse Professional is a flexible simulation tool that can model a wide range of radiocommunication systems and use a wide range of modelling methodologies, including static, area, dynamic, Monte Carlo and more. It uses an object structure of Antennas, Beams, Stations, Carriers Links, Interference Paths that can be combined in an unlimited number of ways to create anything from a 5G network to Starlink, from systems involving a single satellite to those including thousands.
Visualyse Professional is used by many satellite operators to undertake the types of studies required to support non-GSO satellite coordination. It includes features to read satellite orbit data directly from the SRS:
There are also:
- Libraries of pre-coded gain patterns, including those from ITU-R Recommendations such as S.465, S.580, S.672, S.1428, S.1528 etc.
- Libraries of pre-coded propagation models, including those from ITU-R Recommendations such as those in P.525, P.618 and P.676 for Earth-to-space paths and P.452, P.1812 and P.2001 for terrestrial paths
- Satellite selection methods or tracking strategies, using logic such as minimum elevation angle, GSO arc exclusion zone, avoid pointing towards satellites of another system, longest hold time etc.
- Ability to calculate link metrics such as {C, I, C/I, C/N, C/(N+I), I/N, PFD/EPFD} and associated derived statistics including availability / unavailability and throughput
- Ability to model power control algorithms, beamforming antennas and both co-frequency and non-frequency scenarios
- Ability to undertake analysis between satellite systems (e.g. for satellite coordination) or between Earth/terrestrial stations (e.g. for Earth Station coordination) using terrain and clutter databases
- Orbit prediction models such as point mass, point mass plus J2 and SGP4 / SDP4 (*)
- Ability to set orbits to be Sun synchronous and include the impact of the Doppler shift of frequencies (*)
- Ability to set time step down to 1 millisecond or use Monte Carlo methods
- Visualization tools including charting, 2D maps and 3D views, as in the figures below:
(*) Available in the Visualyse Interplanetary version of Visualyse Professional
For example, the screenshot below shows coordination analysis between two non-GSO constellations based upon the analysis in document R19-WP4A/383:
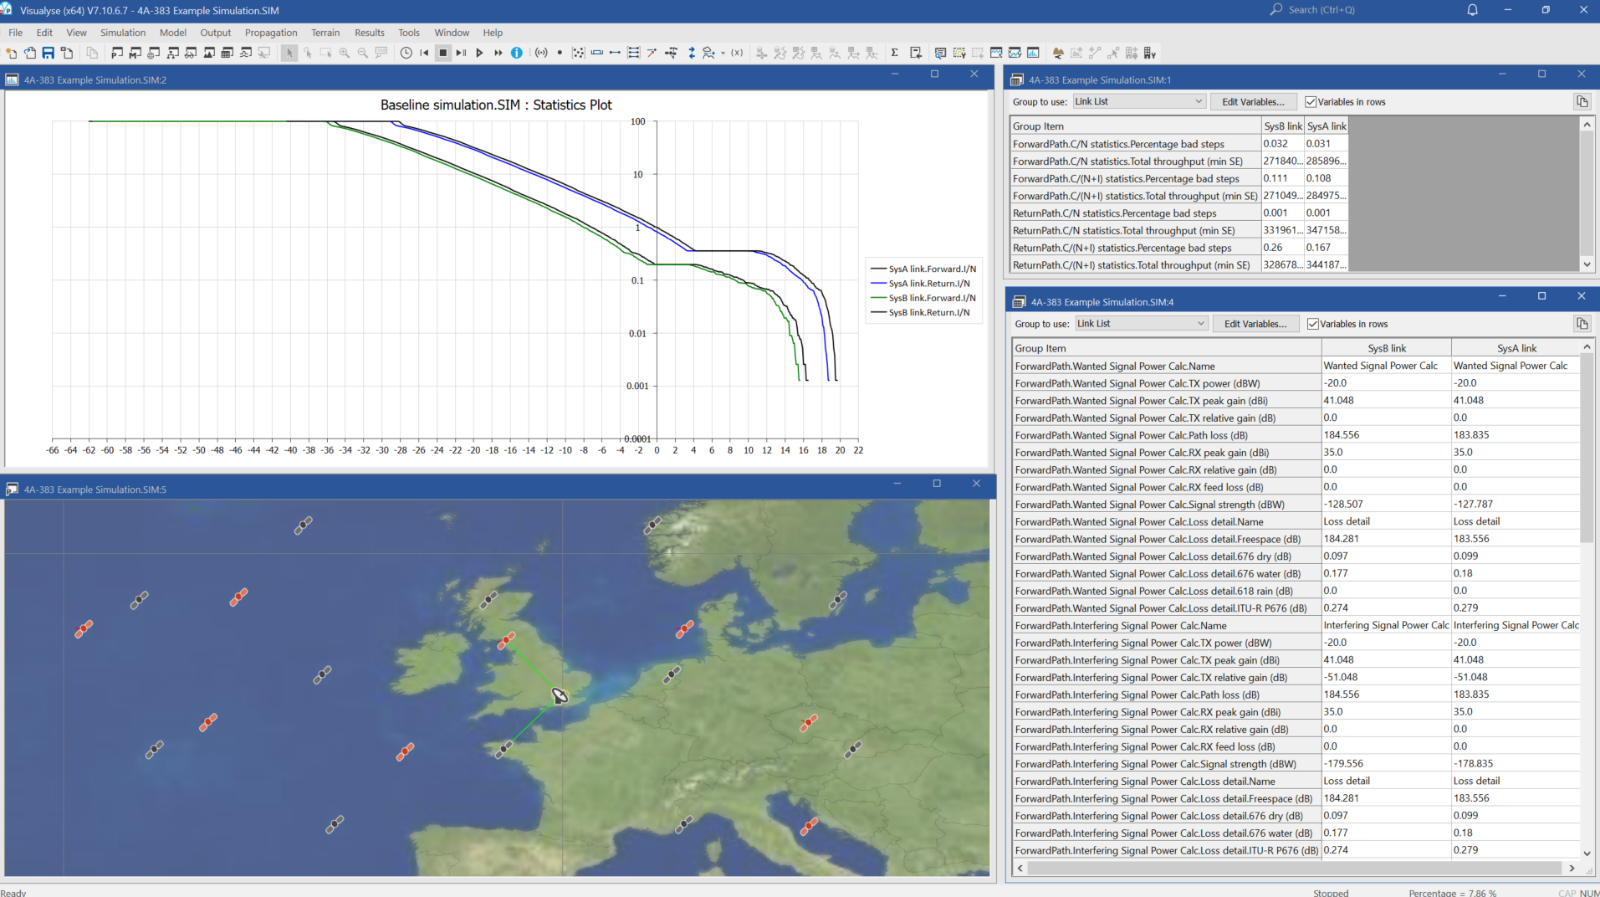
This shows there could be high levels of interference, with I/Ns of around +20 dB. A number of methods could be used to achieve coordination, including:
- Reduce transmit power: to reduce harmful interference into other systems, one method would be to reduce the wanted system’s transmit power. This might be feasible if link analysis suggests that the required service could be provided at lower power.
- Improve antenna gain pattern: this could involve using larger antennas with narrower beamwidths, or using gain patterns with improved sidelobe performance, such as use of Recommendation ITU-R S.580 rather than that in Recommendation ITU-R S.465.
- Accept reductions in performance: if harmful interference into the wanted system only (say) occurs rarely, then the degradation in service might be acceptable. While not ideal, the key objective might be to achieve coordination and a slight degradation might not have a significant impact in the resulting service
- Geographic separation: in some cases, interference can occur if the Earth Station (ES) of the wanted and interfering systems are too close together. This can be mitigated by locating the wanted ES further away from the interfering ES. This is particularly useful in cases where there are small numbers of ESs at known locations, such as gateways. It is less useful where there are large numbers of user terminals (UTs) at locations that cannot be controlled.
- Geographic diversity: a variation on geographic separation allows for use of co-located or nearby located ESs, but with the option to use another site if there is also inline geometry with the satellite(s) of each system
- Avoid pointing: the highest levels of interference typically occur when there is inline geometry, i.e. the line from the ES of one system to its satellite also points at the satellite of the other system. By switching off during these inline geometry cases, interference can be reduced to acceptable levels, though with momentary loss of service. This service loss can be mitigated using geographic diversity, as described above
- Orbit management: for Sun synchronous orbits, ensuring the orbits are not synchronized can assist in reducing interference, but at the cost of constraints on pass times of day
- Polarization: interference can be reduced if each system is using a different polarization, for example, one might be circular and the other linear
In the example above from document 4A/383, interference could be mitigated by use of avoid pointing satellite selection methods.
Earth Station Coordination and Licensing
In addition to coordination of the satellite system, it is necessary to coordinate and license the associated Earth stations (ES). This can take two stages:
- Generation of the coordination contour to identify the area that could be affected by a satellite network
- Detailed analysis of sharing with existing systems and impact of new Earth station.
The first stage can be assisted by use of the Visualyse Coordinate ES coordination tool which generates contours such as this one using the Appendix 7 algorithm:
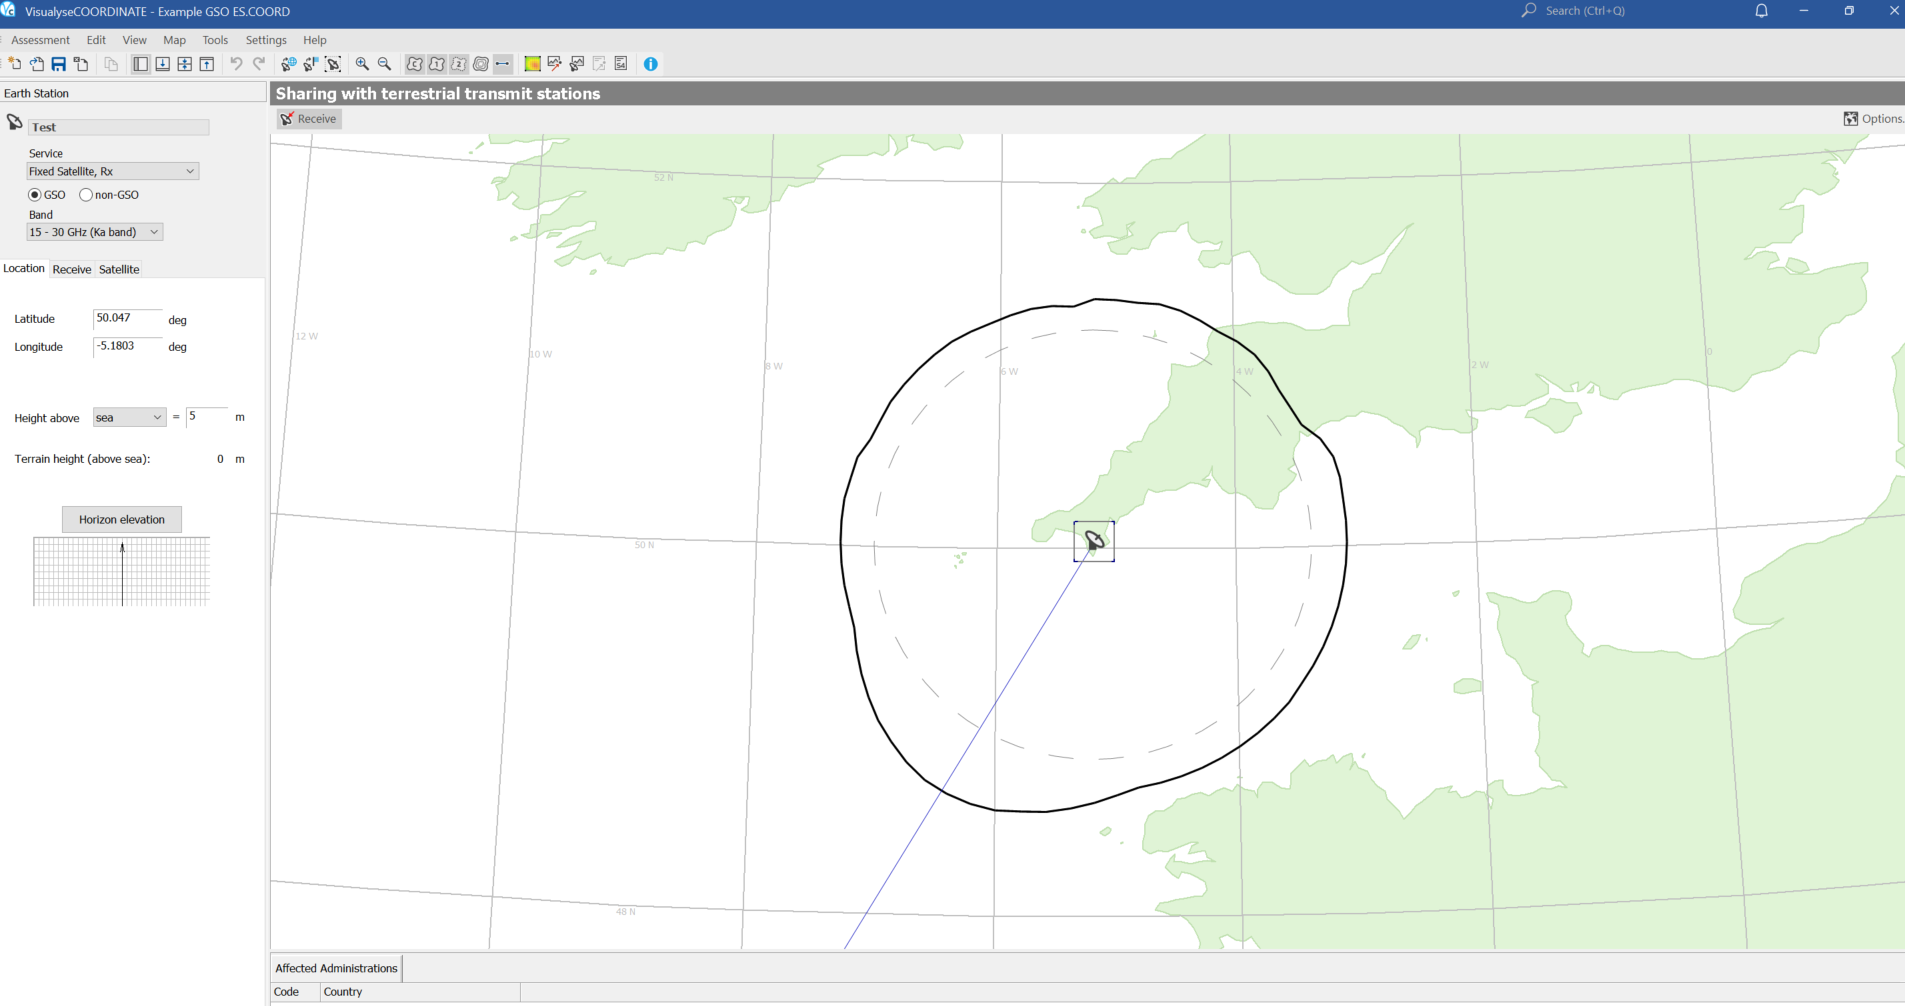
The tool can interface with terrain databases for more accurate analysis and assignment databases to undertake detailed interference analysis with terrestrial fixed links and other satellite ES.
In addition, detailed site-specific analysis can be undertaken using the Visualyse Professional tool. This can include:
- High resolution surface data (e.g. 1m resolution)
- Monte Carlo methods that can be required for non-GSO ES analysis
- Sharing with fixed links and mobile services including 5G BS using phased arrays
- Calculation of PFD around the satellite ES
- Calculation of population within PFD contour or area.
More information is available in this paper.
Conclusions
This paper has shown how the Visualyse range of tools can support development of a non-GSO system from constellation design, including coverage, link, frequency band and service levels, all the way to coordination, licensing and bringing into use. This brings a number of benefits:
- A small set of tools can provide the full range of functionality required to go from non-GSO satellite constellation design to coordination and licensing
- Many of the stages in a non-GSO constellation’s development process can be undertaken using a single tool which can reduce the training requirements
- Simulation files created for one task can be re-used for other tasks
- There is consistency in the analysis across the development process.
We at Transfinite can help the process by providing software tools such as:
- Visualyse Professional to undertake studies of radiocommunication systems, including coverage analysis, capacity and throughput analysis, link budget design and analysis, interference analysis and detailed coordination studies.
- Visualyse GSO to support the coordination trigger process within the ITU-R framework including the Visualyse IFIC Checker
- Visualyse EPFD and associated PFD Mask Generator Tool to undertake analysis of a non-GSO constellation’s ability to meet the EPFD limits in Article 22 and the Resolution 770 thresholds in Article 22.5L, including optimisation of system design
- Visualyse Coordinate to support the coordination of satellite Earth Stations.
In addition, we can provide specialised consultancy services and customisable training to enable your team to undertake all of these activities in-house and develop filings for submission to the ITU.