
Visualyse EPFD

EPFD and Recommendation ITU-R S.1503
Non-GSO satellite networks wishing to operate in parts of C, Ku and Ka band must meet interference thresholds in the Radio Regulations defined using the Equivalent Power Flux Density (EPFD) metric.
The algorithm to determine whether these limits are met is specified in Recommendation ITU-R S.1503 which uses as input parameters data provided in the non-GSO network’s filing such as the Power Flux Density (PFD) or Equivalent Isotropic Radiated Power (EIRP) masks.
Transfinite have implemented this algorithm in a software tool that has recently been tested and delivered to the ITU BR as described below
What is EPFD?
EPFD stands for the Equivalent Power Flux Density, and is defined in Article 22.5C.1 of the Radio Regulations. At first sight this equation looks daunting, but at its core it is relatively straight-forward and builds on the concept of the power flux density or PFD.
The PFD can be calculated from a transmitter’s EIRP as follows:
![]()
It can be seen to represent the power density of the radio signal as it passes through a square unit of distance (typically metres) at a distance d from the transmitter. As the EIRP could vary depending upon the direction (for example if the transmitter didn't use an isotropic antenna), the term depends upon angle, here identified using θ.
The idea of the EPFD is that in many cases the victim receiver has a directional antenna and so the impact of PFD on its performance will depend upon the relative gain towards the interfering station. Hence:
![]()
Now the EIRP in Watts can be calculated from the transmit power P in dBW and transmit gain as follows:
![]()
Also the relative receive gain is the ratio of the receive gain in the required direction to the peak receive gain:
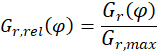
The final stage is to note that the EPFD is an aggregate term and so must be summed over all contributing transmitting stations.
The result is the equation that defines EPFD in Article 22.5C.1 of the Radio Regulations:
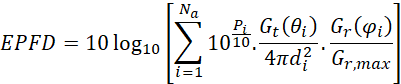
Note that this is in effect a measure of the level of interference at the victim receiver.
Why was EPFD introduced?
The history of EPFD is linked to the development of non-GSO fixed satellite service (FSS) satellite networks in the 1990s, in particular the SkyBridge system shown in the figure below:
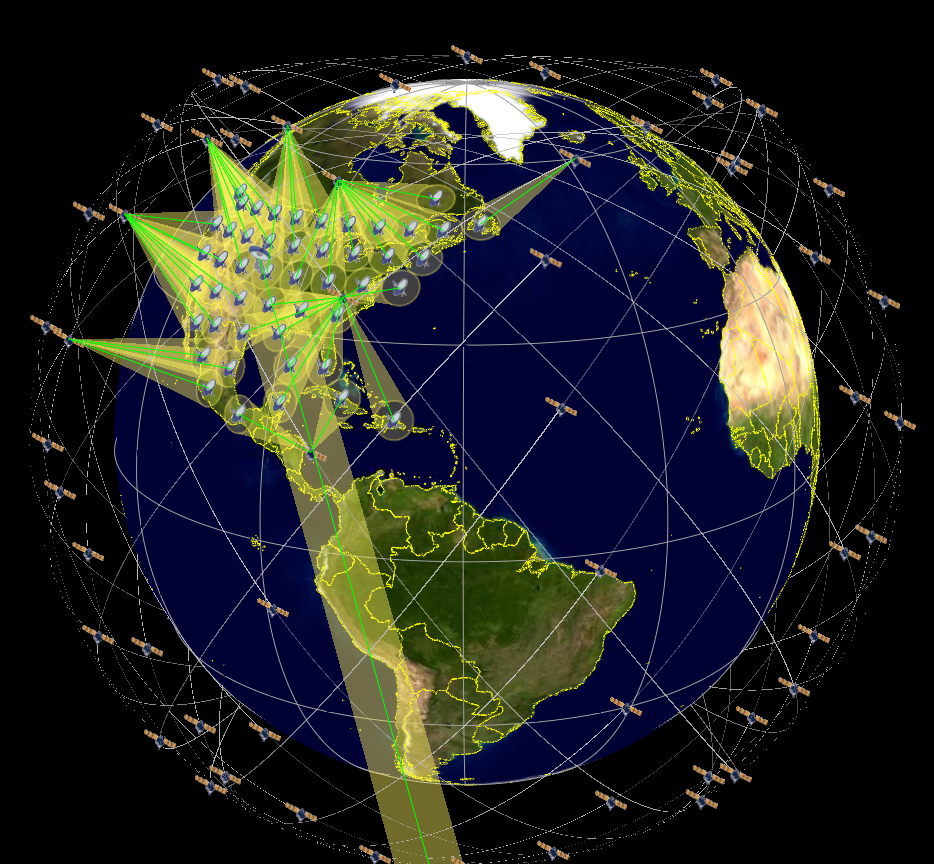
SkyBridge was proposed during the 1990s as an 80 satellite constellation operating in low earth orbit (LEO). It would have provided broadband data services on a near global basis.
It proposed to use parts of Ku band already widely used by GSO satellites. The 1995 Radio Regulations (RR) Article 22.2 included an obligation for non-GSO space stations to “cease or reduce to a negligible level their emissions … whenever there is unacceptable interference” to GSO satellite systems.
This caused two problems for the non-GSO operator, namely:
- How to define “unacceptable interference”?
- How to get the agreement of all of the many GSO operators?
There was a consequential concern to the GSO operators:
- How to ensure their systems would be protected from interference from the non-GSO network?
EPFD was the solution to these three questions:
- It defined what would be an acceptable level of interference in terms of the EPFD metric
- Any non-GSO network that met these limits were considered to have met their requirements under Article 22.2 to protect the GSO
- These limits were not to be exceeded for any location for any GSO network, hence providing GSO operators the protection they needed.
Different types of EPFD
It should be noted that there are different types of EPFD which provide different levels of protection. Firstly there are a number of different interference paths that need to be considered:
- EPFD(down): interference from the non-GSO satellite’s downlink into the GSO system’s downlink
- EPFD(up): interference from the non-GSO satellite’s uplink into the GSO system’s uplink
- EPFD(is): intersatellite interference from the non-GSO satellite’s downlink into the GSO system’s uplink
In Article 22 of the RR there are, therefore, three sets of EPFD “hard limits” which the non-GSO system might have to meet, depending upon the frequency band(s) used.
The EPFD thresholds vary by frequency band, percentage of time and also receive antenna. A set of curves of EPFD vs. percentage of time are defined in the RR for the receive antenna gain patterns to be protected. An example is shown in the figure below:
.png)
These EPFD levels are to be calculated using simulation (as discussed in the following section) and compared against the hard limits in Article 22.
Note that there are also addition “operational EPFD” limits which are those that would be measured by an active non-GSO FSS network, but these are not considered further in this document.
Article 22 vs. 9.7A and 9.7B
As well as the hard limits in Article 22, Appendix 5 also identifies situations where EPFD is used as a trigger for coordination under Articles 9.7A and 9.7B.
The conditions for Ku band at or below 12.75 GHz (and in brackets for frequencies above) are:
- Frequency overlap
- ES antenna gain >= 64 dBi (68 dBi)
- G/T >= 44 dB/K
- Emission bandwidth >= 250 MHz (800 MHz)
These are what are called the “Large Earth Stations” or LESs.
If these conditions are met then there are additional EPFD limits to check against. For Ku band at or below 12.75 GHz they are:
- -174.5 dBW/m^2/40 kHz if the non-GSO satellites are at or below 2,500 km altitude
- -202 dBW/m^2/40 kHz if the non-GSO satellites are above 2,500 km altitude
Both limits are for 100% of time and, as noted earlier, are coordination triggers rather than hard limits.
EPFD and Rec. ITU-R S.1503-2
Article 22 of the Radio Regulations defines hard limits that non-GSO FSS networks must meet – and which the ITU Radiocommunication’s Bureau (BR) must check – but how are they to do that?
The answer is the algorithm specified by Recommendation ITU-R S.1503: Functional description to be used in developing software tools for determining conformity of non-geostationary-satellite orbit fixed-satellite system networks with limits contained in Article 22 of the Radio Regulations
This document, mostly written by Transfinite consultants, defines how to calculate the EPFD levels that would be generated by a non-GSO network given parameters filled with the BR according to Appendix 4.
A key inputs are the power levels emitted by the non-GSO satellite and its earth stations, and the way these are defined depends upon the EPFD direction:
- EPFD(down): via a satellite emission PFD mask
- EPFD(up): via a non-GSO ES EIRP mask and deployment model
- EPFD(IS): via a satellite EIRP mask
The reason for using masks is it permits the non-GSO to change their operational systems as long as they do not exceed the mask filled with the BR. In particular the use of the PFD mask for EPFD(down) simplifies the EPFD calculation to:
![]()
This PFD mask can be defined in a number ways, including:
-
Alpha angle and difference in longitude
-
Azimuth and elevation at the non-GSO satellite
The alpha angle is a key concept in Rec. S.1503 and it is defined as the minimum angle between:
- The line from the GSO ES to the non-GSO satellite
- The line from the GSO ES and any test point on the visible GSO arc
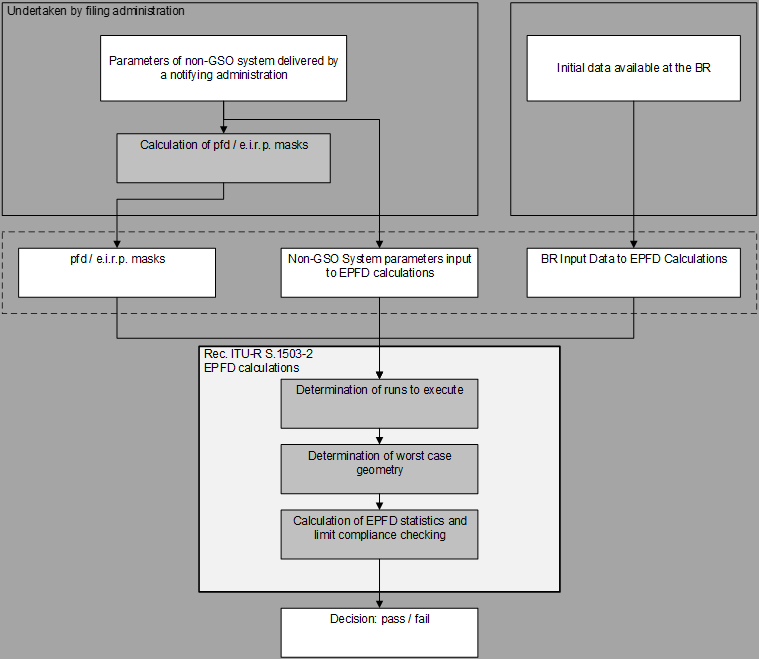
Rec. S.1503 comprises a number of key stages:
- Identifying from the data filed and the EPFD thresholds in Article 22.2 what runs are required
- For each run, identifying what location of GSO satellite and ES should be used in the run, defined as the Worst Case Geometry (WCG)
- For each run, using the WCG locations for the GSO satellite and ES, simulating the non-GSO satellite system for sufficient time to get statistics of EPFD
By comparing the EPFD statistics calculated against the EPFD thresholds it is possible to get a pass/fail decision.
These blocks are shown in the figure below:
The Worst Case Geometry
A key concept in the algorithm in Rec. S.1503 is to select the location of the GSO satellite and ES that is the “worst” case. Here worst is interpreted as giving the highest single entry EPFD or, if there are multiple locations with equally high single entry EPFD, the one that would have this EPFD value for the largest percentage of time.
This can be very complex to calculate given the wide range of possible inputs! It depends upon:
- The PFD mask
- The satellite network’s orbit parameters
- The run’s ES antenna pattern
- The system’s operating parameters such as minimum elevation angle and number of co-frequency satellites etc.
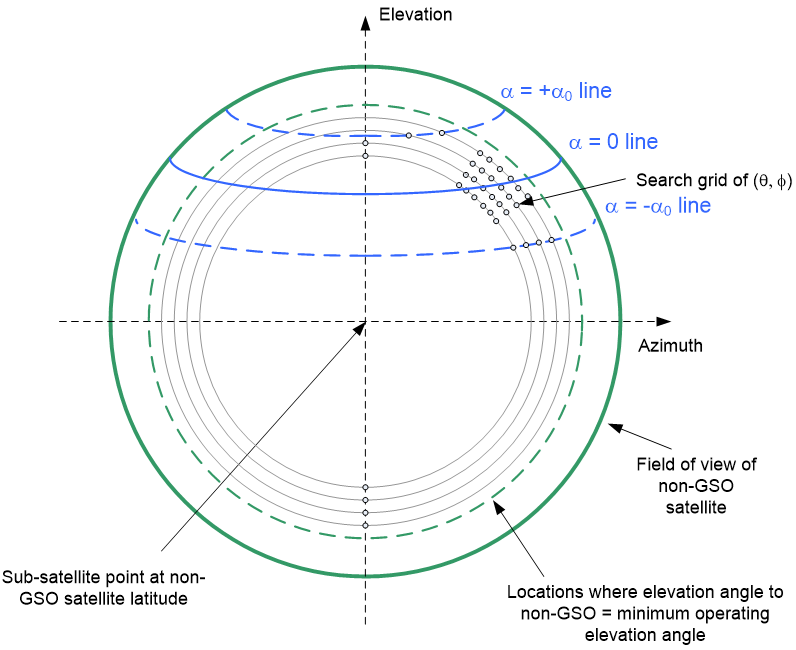
Typically it is necessary to search across the field of view of the non-GSO satellite, a task complicated by the use of the non-linear alpha angle as shown in the figure below:
Software Development
In order for the ITU BR to have available software tools that implement the algorithm in Rec. S.1503-2, it issued two parallel contracts to Transfinite and Agenium.
Having two independently developed implementations brings three benefits:
- Confidence in results: so that the BR and other parties (such as administrations) are able to check the result between tools
- Bringing an independent viewpoint on the algorithm in the Recommendation
- Assists in testing stage of development by having a set of results to compare against
Work started in July 2015 with delivery to the BR of tested software at the end of April 2016.
Testing
The software was extensively tested, considering all aspects including the runs generated, WCG, time step size, number of time steps, orbit model and resulting EPFD statistics.
A set of test constellations were constructed that covered the different types of non-GSO system that could be envisaged, such as circular or elliptical, repeating or non-repeating, equatorial or inclined etc.
Testing included hundreds of runs and billions of time step with the largest error spotted under 0.05 dB. Over all the test cases there was very good agreement.
User Interface
We have been using EPFD as a metric in our main simulation study tool, Visualyse Professional, for many years prior to the inclusion of EPFD in the Radio Regulations. Many of the studies of the SkyBridge system in the 1990s were undertaken using our software products.
But the algorithm in Recommendation ITU-R S.1503 is highly specialised and in particular the user interface requirements are very different.
Visualyse Professional is what we call a “Study Tool” – you can ask “what if?” questions and see what the outcome would be, undertaking sharing studies between a very wide range of service types. This means that the user interface has been designed for flexibility, allowing almost any input parameter to be modified.
However analysis under Rec. ITU-R S.1503-2 is in principle a lot simpler because:
- The inputs are defined by Appendix 4 and captured in the ITU’s SRS database
- The output is a yes/no decision together with supporting results such the EPFD cumulative distribution functions (CDFs)
We therefore decided to develop a tool that specifically implements the algorithm in Rec. ITU-R S.1503-2, and that product is called Visualyse EPFD.
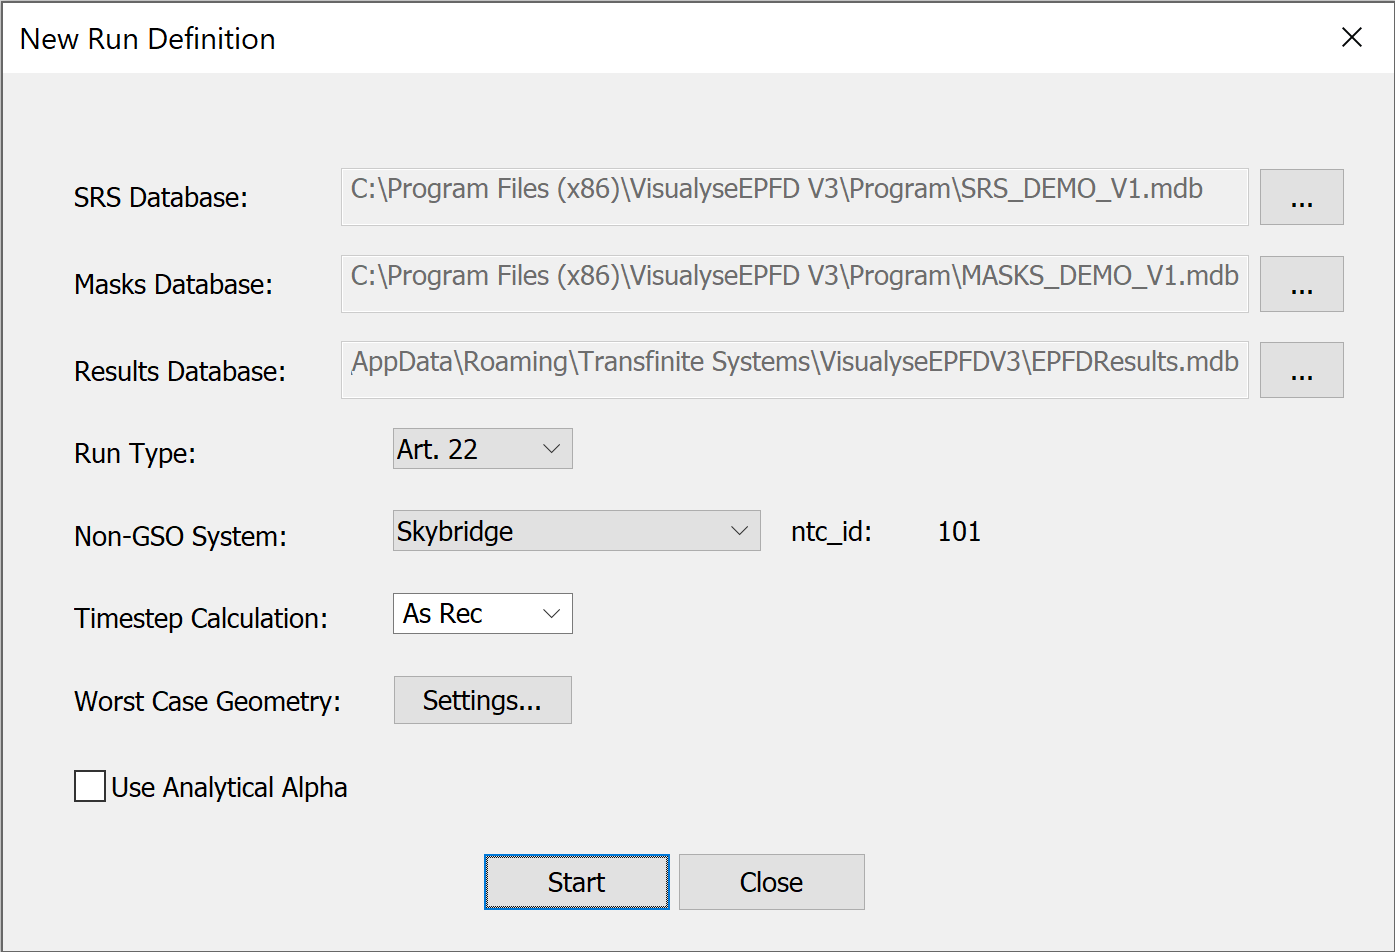
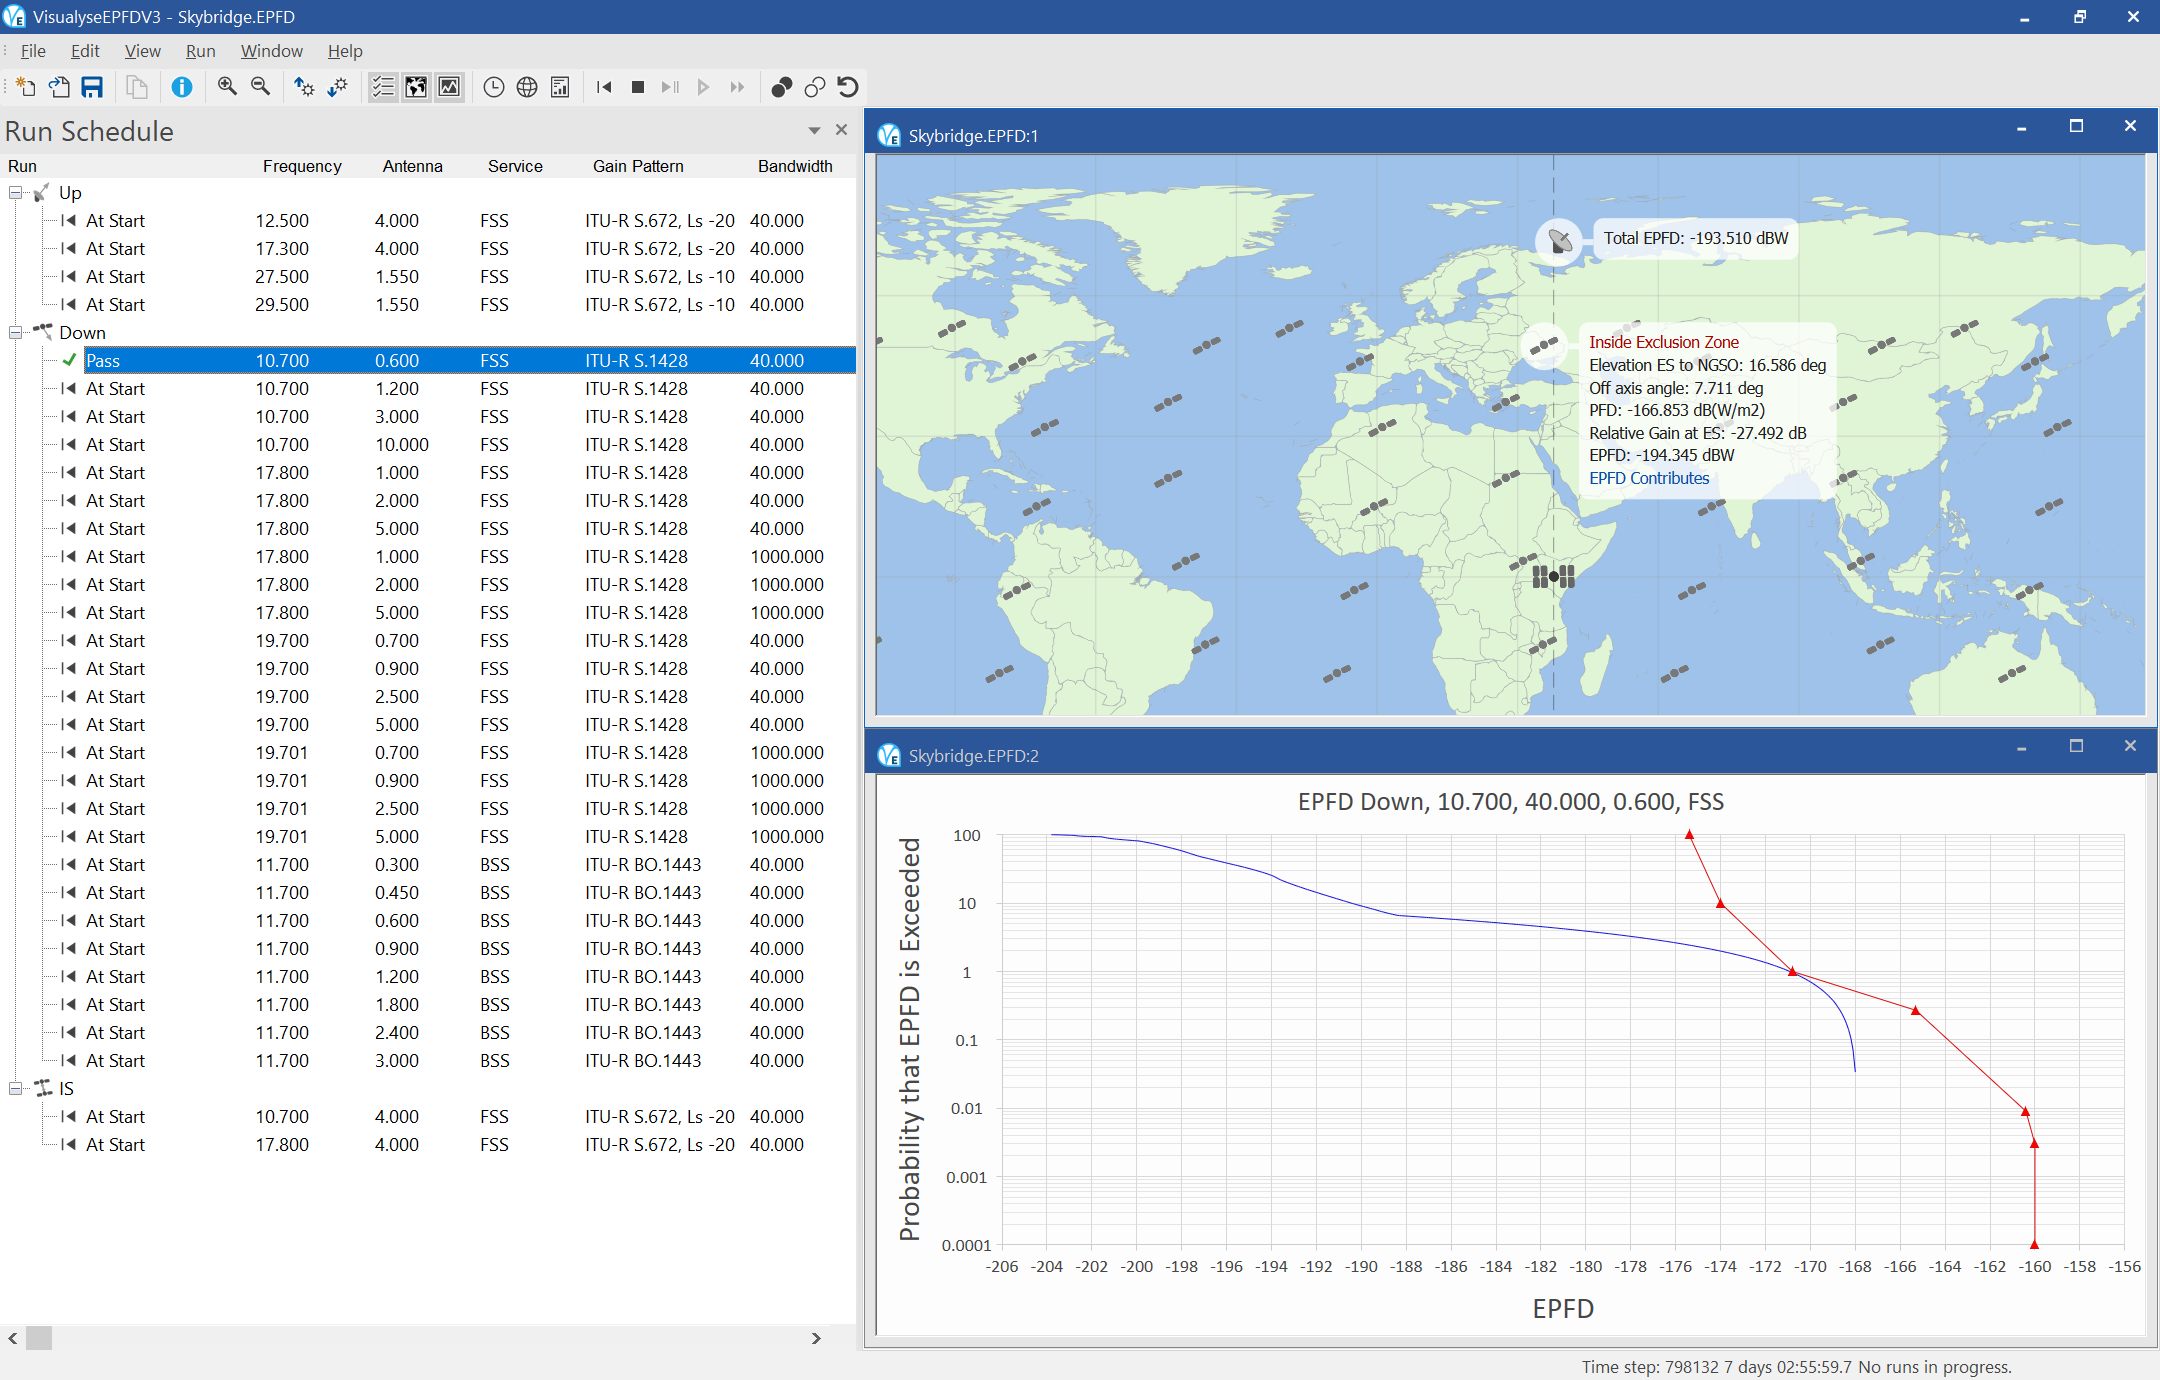
The input is a selection of the network to analyse as shown in the figure below:
From this Visualyse EPFD queries the thresholds in Article 22 of the RR to develop the runs required as in the list below:
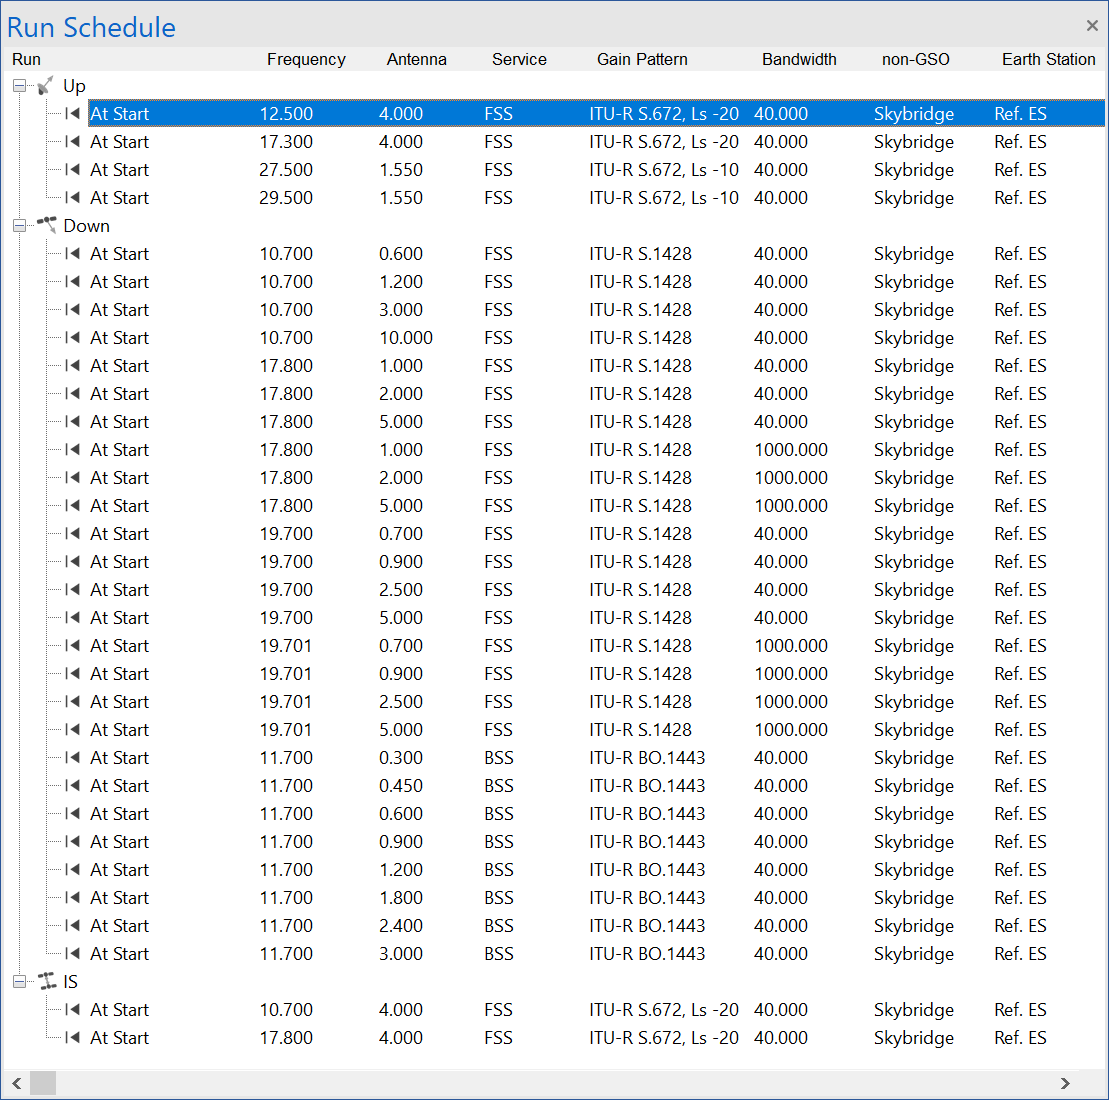
For each run Visualyse EPFD calculates the WCG and run duration time step size.
The software includes a graphical user interface (GUI) that shows the location of each of the satellites and gives feedback as to the intermediate values of the EPFD calculation:
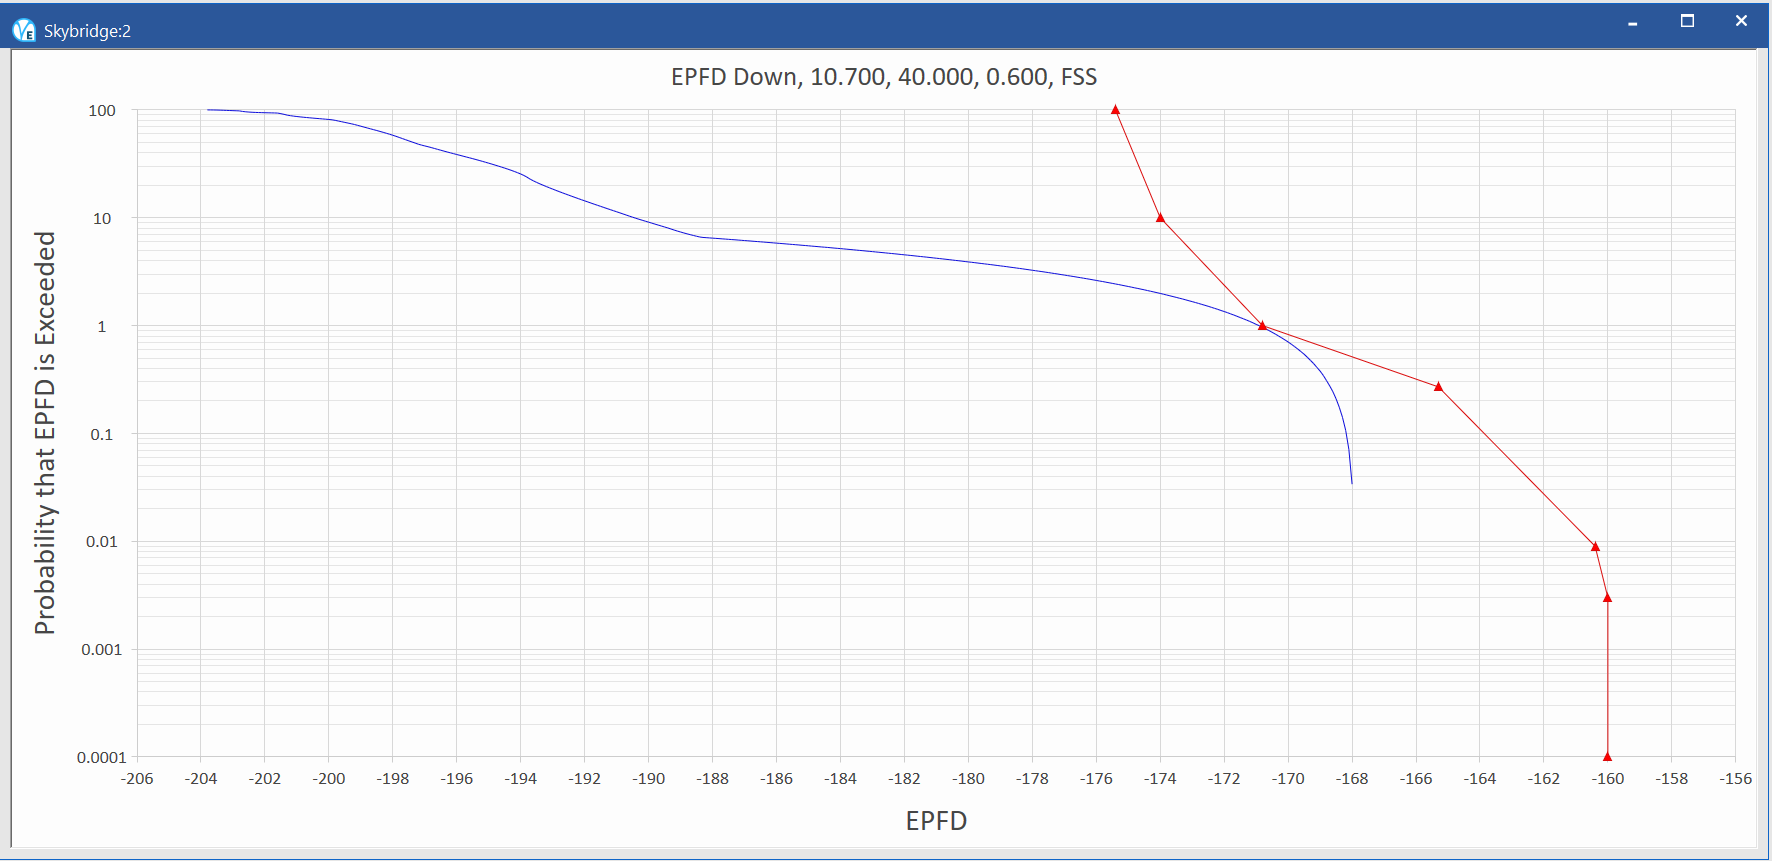
At the end of each run the CDF of EPFD is compared against the threshold in Article 22 of the RR to give a pass / fail decision. The EPFD CDF is in blue, the threshold in red.
How we can help
We are world experts on EPFD and the verification of non-GSO networks against the limits in Article 22 of the Radio Regulations.
Our Visualyse EPFD software is the leading implementation of the algorithm in Rec. ITU-R S.1503. It has been verified during testing with the ITU BR and can calculate:
- EPFD(up)
- EPFD(down)
- EPFD(IS)
It can also analyse both the Article 22 and Articles 9.7A and 9.7B cases.
It is available in two versions, one the ITU’s “black-box” for pass/fail decisions and the other a product with graphical user interface that provides feedback on the calculation process and allows additional options to be modified.
Visualyse Professional
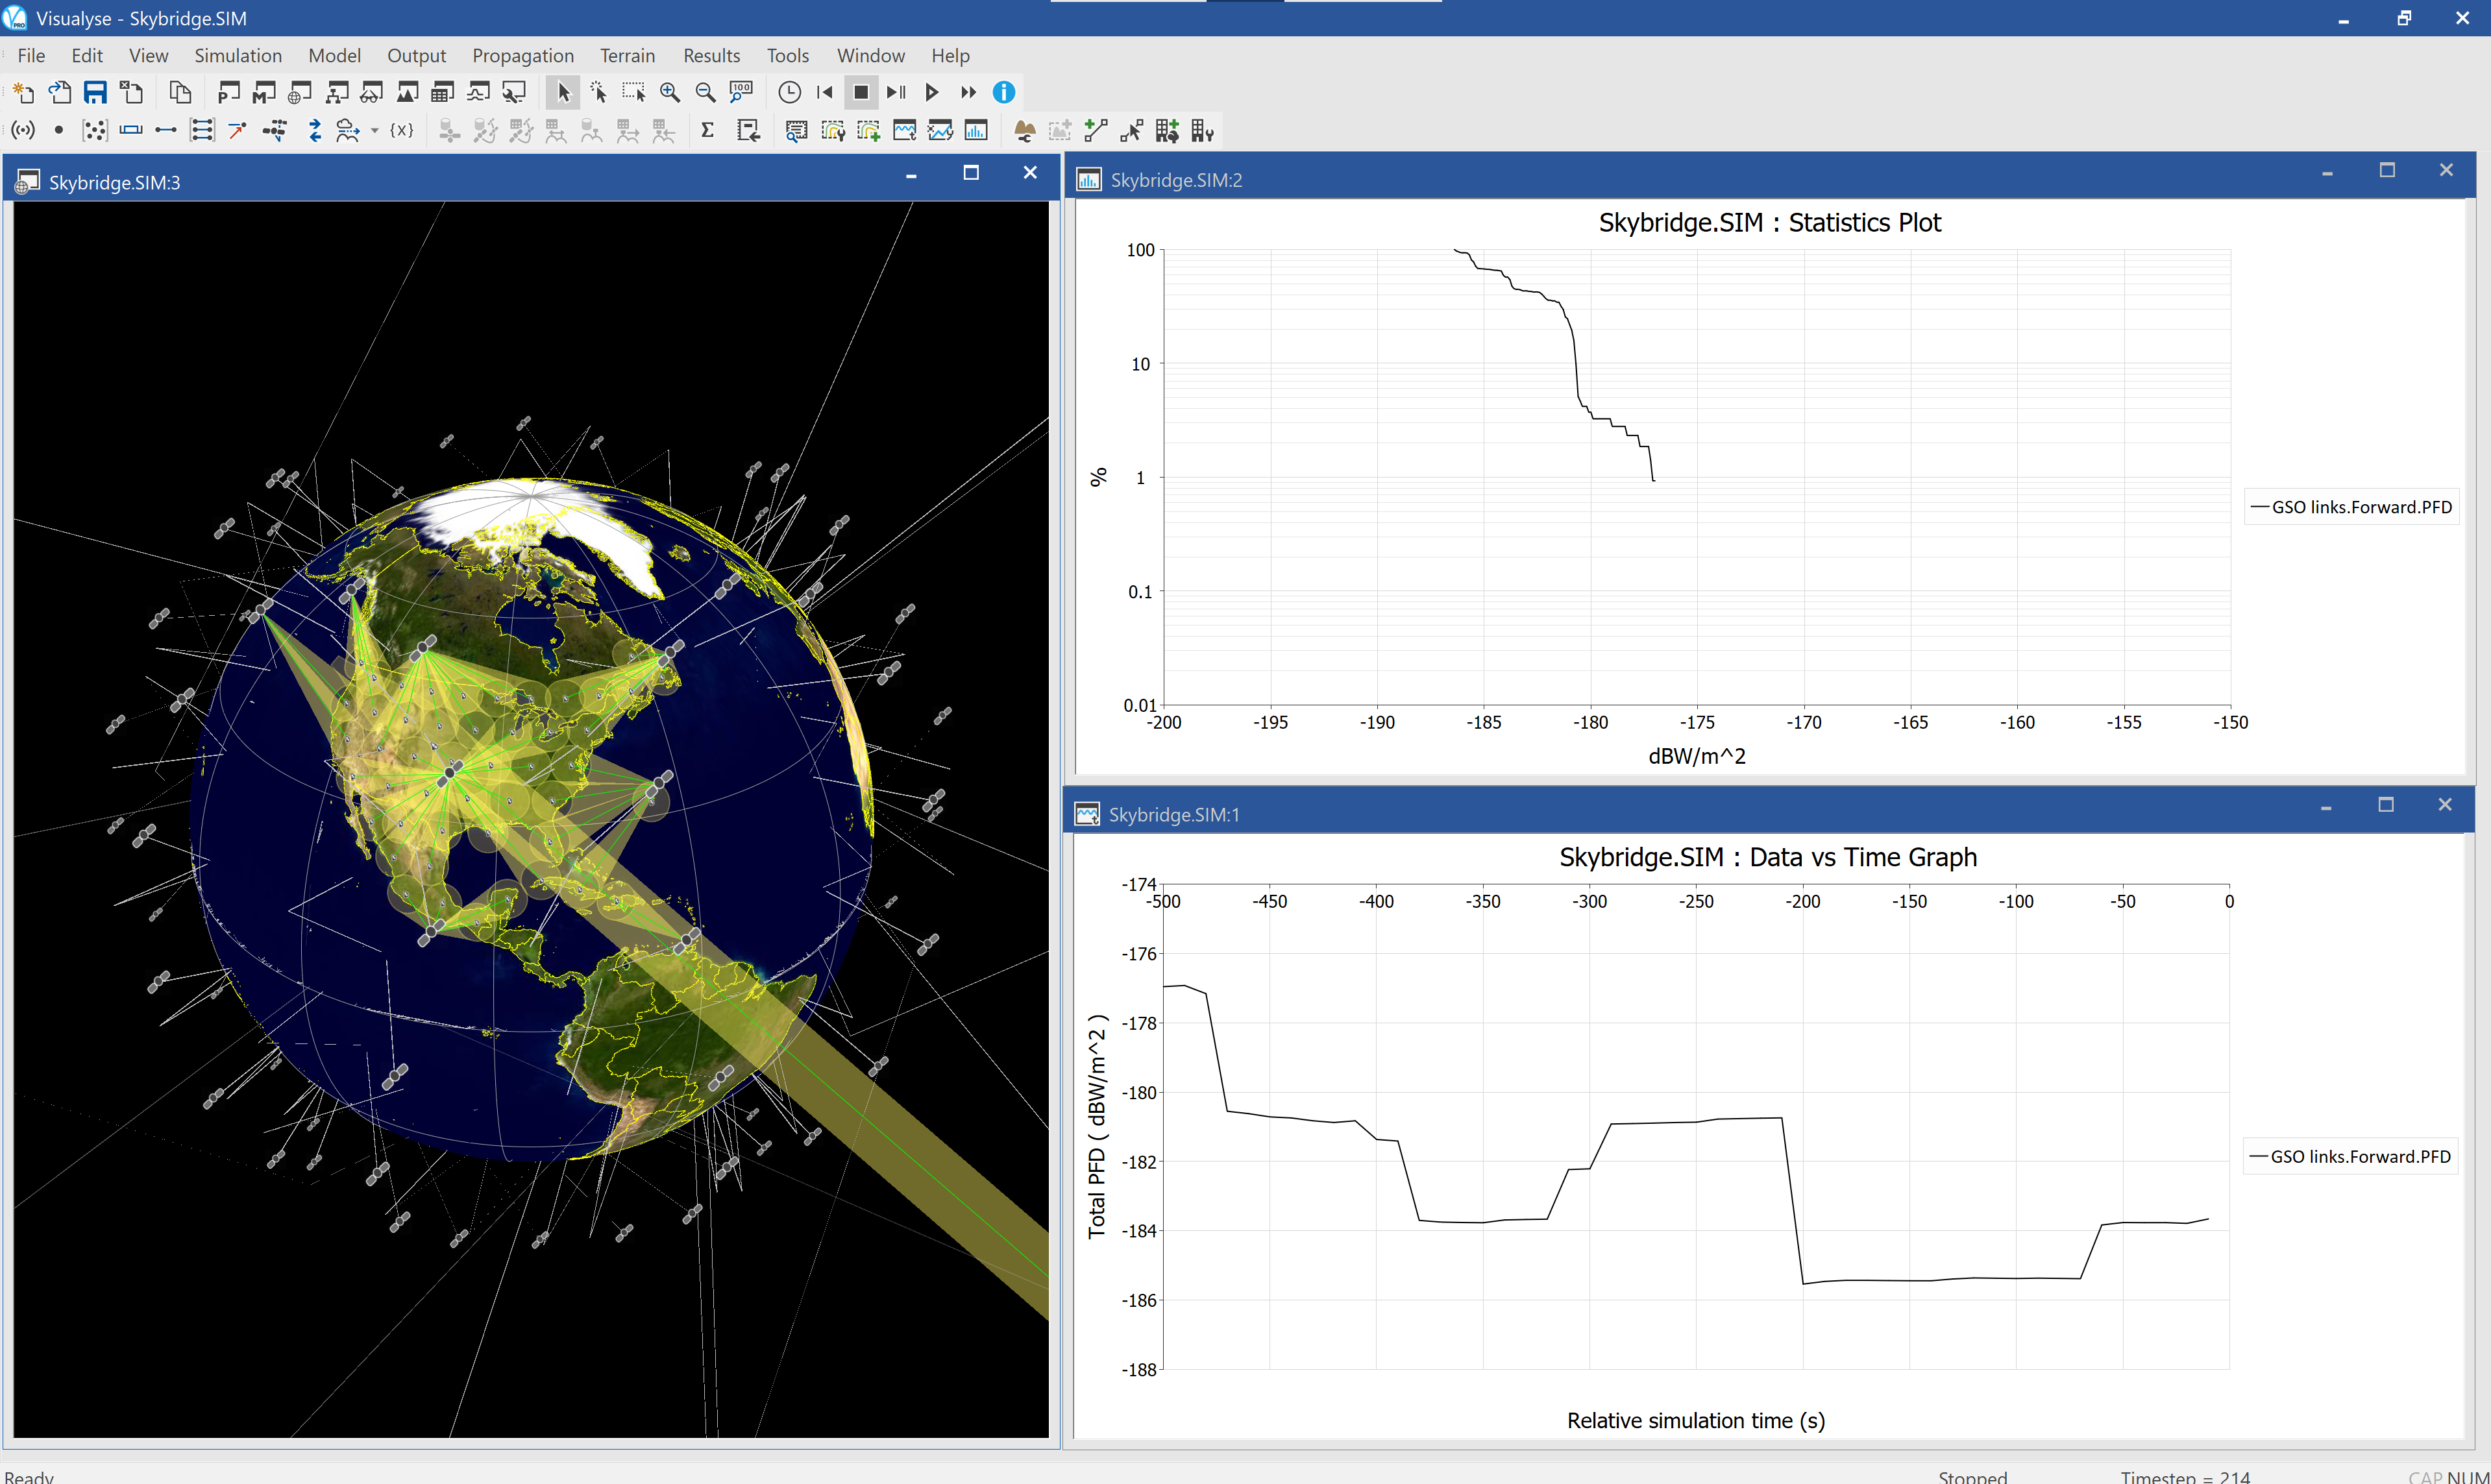
Our desktop study tool Visualyse Professional can be used to analyse radio systems including both GSO and non-GSO networks.
Visualyse Professional calculates EPFD using a full simulation approach that models each beam and the tracking strategies involved.
This can model actual operation and include all the three EPFD cases of up, down and intersatellite. It could, for example, be used during the coordination triggered by Article 9.7A and 9.7B of the RR.
Visualyse GSO
We have developed Visualyse GSO to support satellite coordination tasks. It includes IFIC/SRS checking, detailed C/I calculations. It can be also used to identify coordination requirements of non-GSO satellites.
Contact and further information
If you have any questions or would like more information please do not hesitate to contact us
Additional information is available in the presentation to the ITU-R workshop on non-GSO satellite issues