
27
Mar
Abstract
There is currently significant interest in the satellite and mobile industries in the potential to provide communication services from satellites direct to users with unmodified handsets. These types of systems are sometimes called direct-to-device (D2D), non-terrestrial networks (NTN) or supplementary coverage from space (SCS) and could involve a constellation of low Earth orbit satellites with large antennas that have the ability to provide such a service. But this brings in technical and regulatory challenges, from the type of services that can be provided, how to optimise coverage, capacity and throughput to the potential for interference to other services including terrestrial networks. This White Paper shows how these types of studies can be undertaken using the Visualyse tools.
Background
Early in 2024, SpaceX launched six Starlink satellites with D2D capability, highlighting an acceleration of developments in the field of non-terrestrial networks. Previously, in 2023, AST SpaceMobile launched the BlueWalker 3 satellite which successfully connected with unmodified smartphones. Lynk Global is also developing its own D2D constellation. Simultaneously with the development of non-GSO constellations, work within 3GPP has incorporated support for NTN where issues to address include latency and Doppler compensation.
Whereas the engineering and standardisation tracks have made progress, the regulatory framework for D2D systems is still under development, with a new agenda item agreed at WRC-23. Some of the proposed D2D satellite networks are operating under a minimal “no interference, no protection” basis under Article 4.4 and there has been concern that this would not give terrestrial networks sufficient protection or certainty for the satellite network. Hence, the new agenda item 1.13 for WRC-27 to consider possible new allocations for mobile satellite service in parts of the UHF band taking into account the frequency arrangements used for terrestrial mobile networks.
In the US, SpaceX is working with T-Mobile to both provide a service which will handle both interference management and user contract including roaming rights. This approach requires close cooperation between satellite and terrestrial operators and there have been concerns that it might not provide sufficient protection for systems in adjacent bands or countries. For example, in the US, AT&T has raised concerns with the FCC at the potential for interference from SpaceX system into their operations in an adjacent frequency band. Other concerns have been raised, such as the FCC rejecting a plan for Starlink to operate at very low Earth orbits (VLEO) due to concerns about space traffic management with the International Space Station.
But why would SpaceX wish to operate at VLEO and what types of interference scenarios could there be? What are the critical factors involved in designing a D2D constellation and avoiding harmful interference into other systems?
These are complex scenarios to model, but Visualyse is designed to model just these types of systems and those that a D2D constellation could share with, including terrestrial mobile, as discussed below.
Modelling a D2D Constellation
This section and the following one describes modelling of a D2D constellation and sharing with terrestrial services. All analysis was done using invented parameters and a SpaceX filing, and might not be representative of actual systems.
Overview
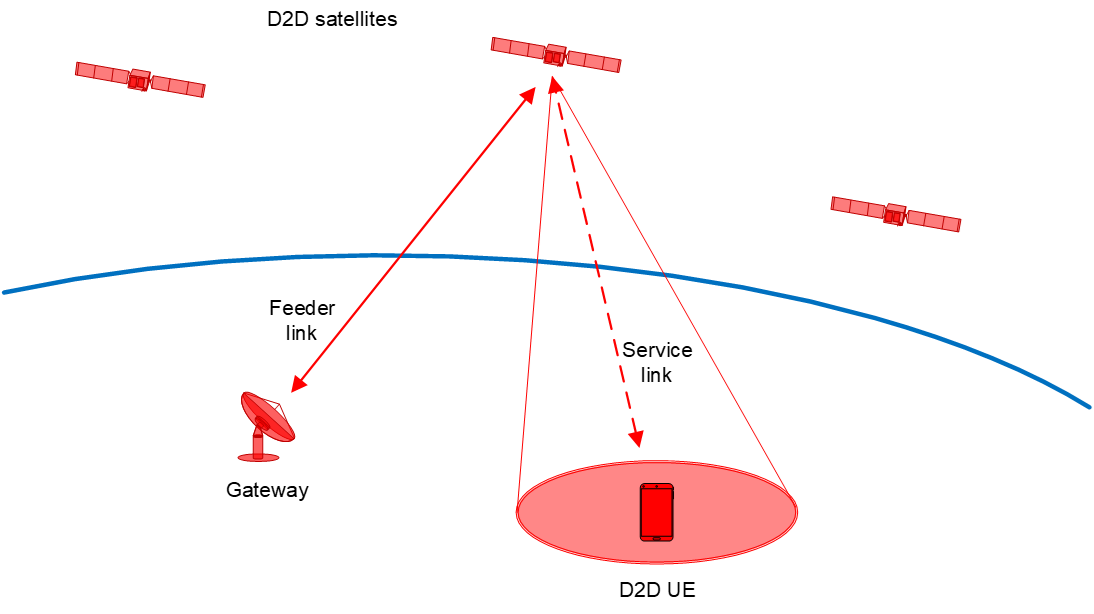
A D2D constellation consists of two main elements:
- Space segment: this involves a constellation of hundreds or even thousands of satellites in low Earth orbit. The number of satellites required will depend upon the required latency, link budget parameters and constellation sizing, with more satellites required for lower altitudes.
- Ground segment, including the user equipment (UEs) and gateways. In this White Paper we will concentrate on providing service to UEs, in particular unmodified mobile phone handsets.
The figure below shows these key elements:
Designing the Non-GSO Constellation
Two key attributes will impact the performance of a given non-GSO constellation to provide D2D services:
- The coverage statistics of the constellation
- The link budgets between the satellite and the UE.
These two are related and connected to the constellation configuration, and in particular the orbit altitude, with some of the benefits and costs as in the table below:
| Costs | Benefits | |
|---|---|---|
| Lower altitude | More satellites = more capital expenditure Increased orbit drag / lower satellite lifetime | Lower latency Lower path length = better C/N for a given transmit power or less power required |
| Higher altitude | Higher latency Longer path length = worse C/N for a given transmit power or increased power required | Few satellites = lower capital expenditure Lower orbit drag / longer satellite lifetime |
Some of the problems of lower C/N for higher altitude satellites can be overcome by more complicated and larger satellites, but with consequential cost implications.
Design of a non-GSO constellation involves trade-offs and usually some iteration to identify a set of candidates. Choice of preferred constellation is likely to require non-technical topics including finance and business related factors. The key is to be able to analyse candidates and identify the implications of using different orbits and technologies.
Coverage Analysis
The first stage is typically to undertake coverage analysis of a proposed non-GSO constellation. This identifies metrics such as:
- Number of satellites available to provide a service
- Lowest elevation angle of highest (or second highest) elevation satellite over a time period such as a day.
With constellations that do not maintain a repeating ground track, these will depend upon latitude only.
The constellation below was used to undertake an example coverage analysis:
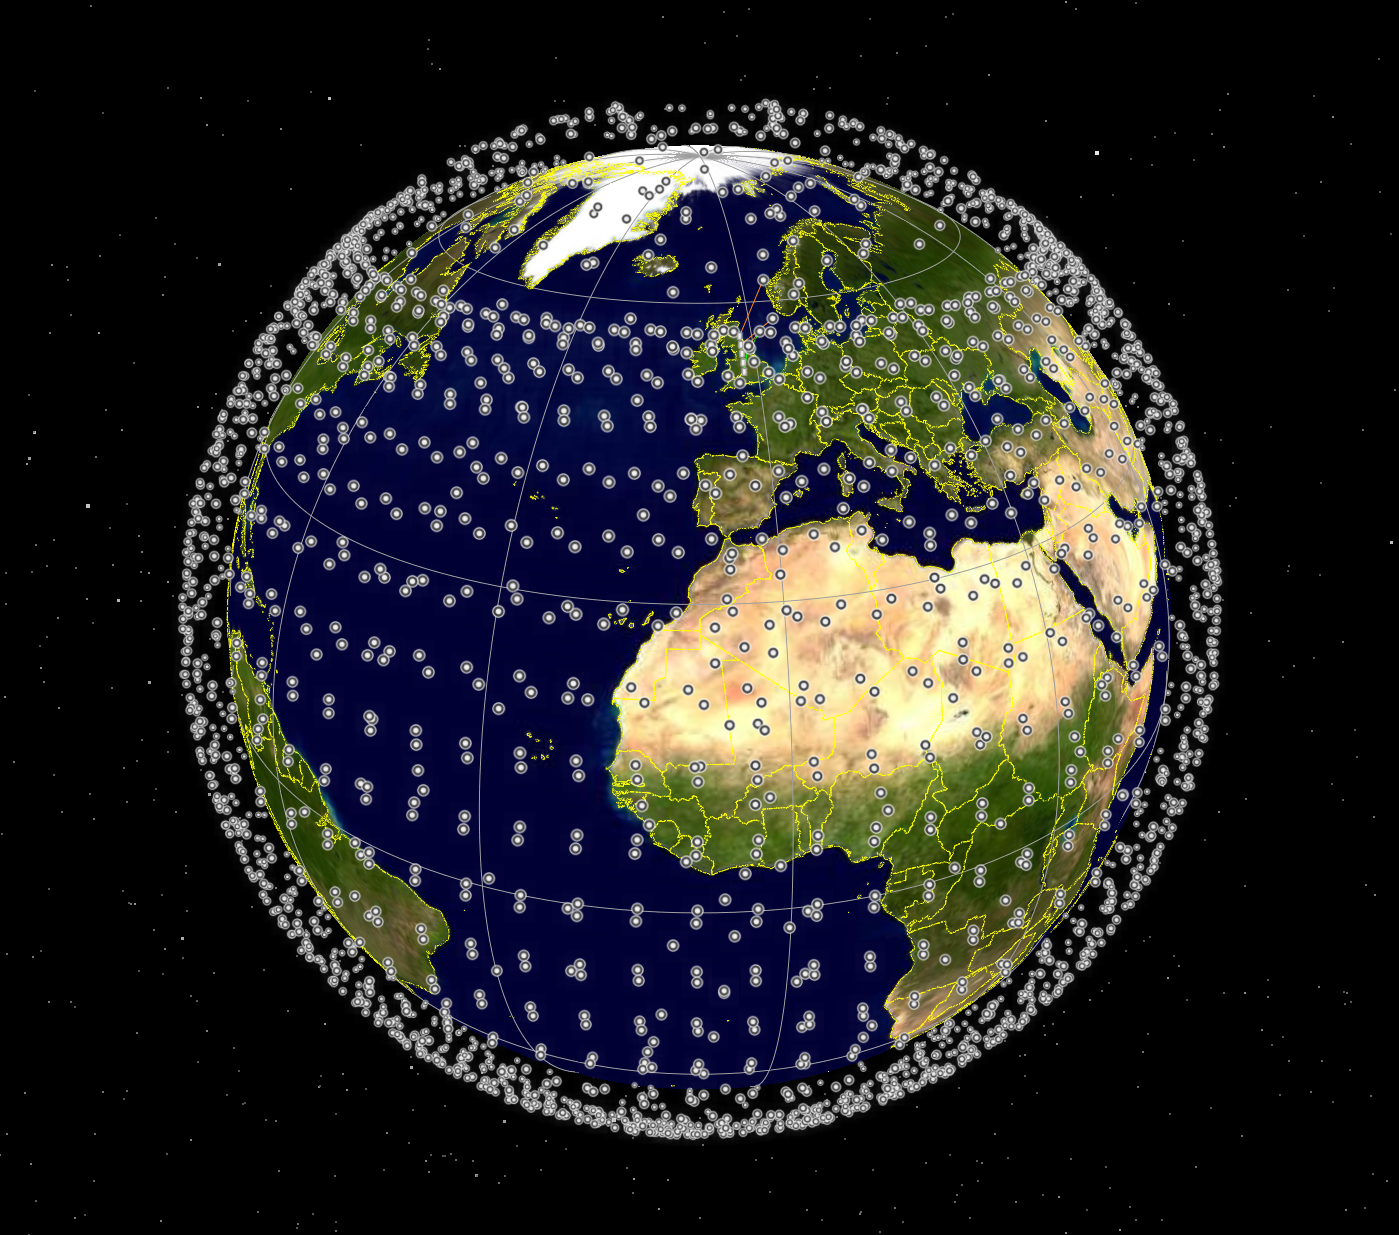
This constellation, based upon a SpaceX filing, contains over 4,400 satellites at an altitude between 550 and 570 km, most at an inclination angle of around 53 degrees but with some polar planes.
Consider a set of test points in the UK, around the boundary of the inclination angle of the majority of the satellites:
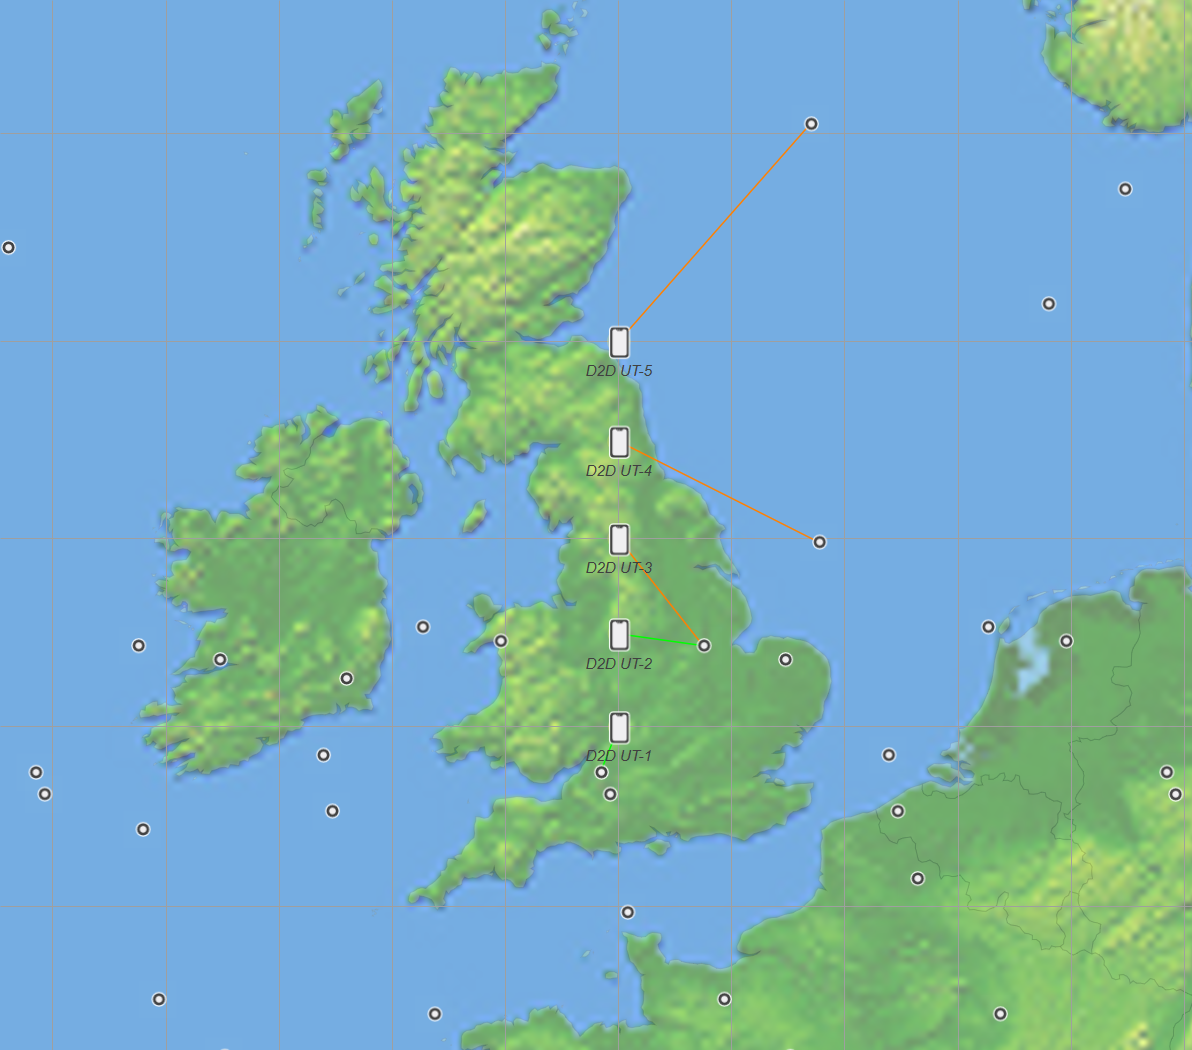
For these test locations, it is possible to calculate the number of satellites above a minimum elevation angle and then the minimum elevation angle used if the UE were to select the highest available satellite at each time step. For D2D to UEs, it is useful to have as short a path length as possible, which means as high as possible an elevation angle so a minimum elevation angle of 50 was used in the statistics in the table below:
| D2D UE No. | D2D Latitude (deg N) | Lowest number of available satellites | Minimum highest elevation angle used (deg) |
|---|---|---|---|
| 1 | 52 | 10 | 75.8 |
| 2 | 53 | 8 | 76.3 |
| 3 | 54 | 6 | 68.9 |
| 4 | 55 | 4 | 61.2 |
| 5 | 56 | 1 | 53.2 |
It can be seen that the best coverage is at around 52N and 53N, which is the inclination angle of the majority of the satellites of the constellation, but there is a significant reduction for higher latitudes.
This type of analysis can be extended to compare different constellation configurations and an extended range of metrics over a wider area.
Link Budget Analysis
For these latitudes, link budgets can be created for both the uplink and downlink directions. The propagation models were assumed to be free space path loss plus the gaseous attenuation in Recommendation ITU-R P.676.
Parameters used for these systems are currently under development and it was necessary to make a number of simplifying assumptions to create the examples in this section as identified in the table below:
| Direction | UL | DL |
|---|---|---|
| Frequency (MHz) | 1900 | 2100 |
| Bandwidth (MHz) | 5 | 20 |
| Tx power (dBW) | -8 | 10 |
| Tx peak gain (dBi) | -3 | 31.1 |
| Tx gain pattern | Isotropic | M.2101 |
| Rx peak gain (dBi) | 31.1 | -3 |
| Rx gain pattern | M.2101 | Isotropic |
| Rx noise (K) | 300 | 1500 |
| Tr(C/N) (dB) | 2.5 | 2.5 |
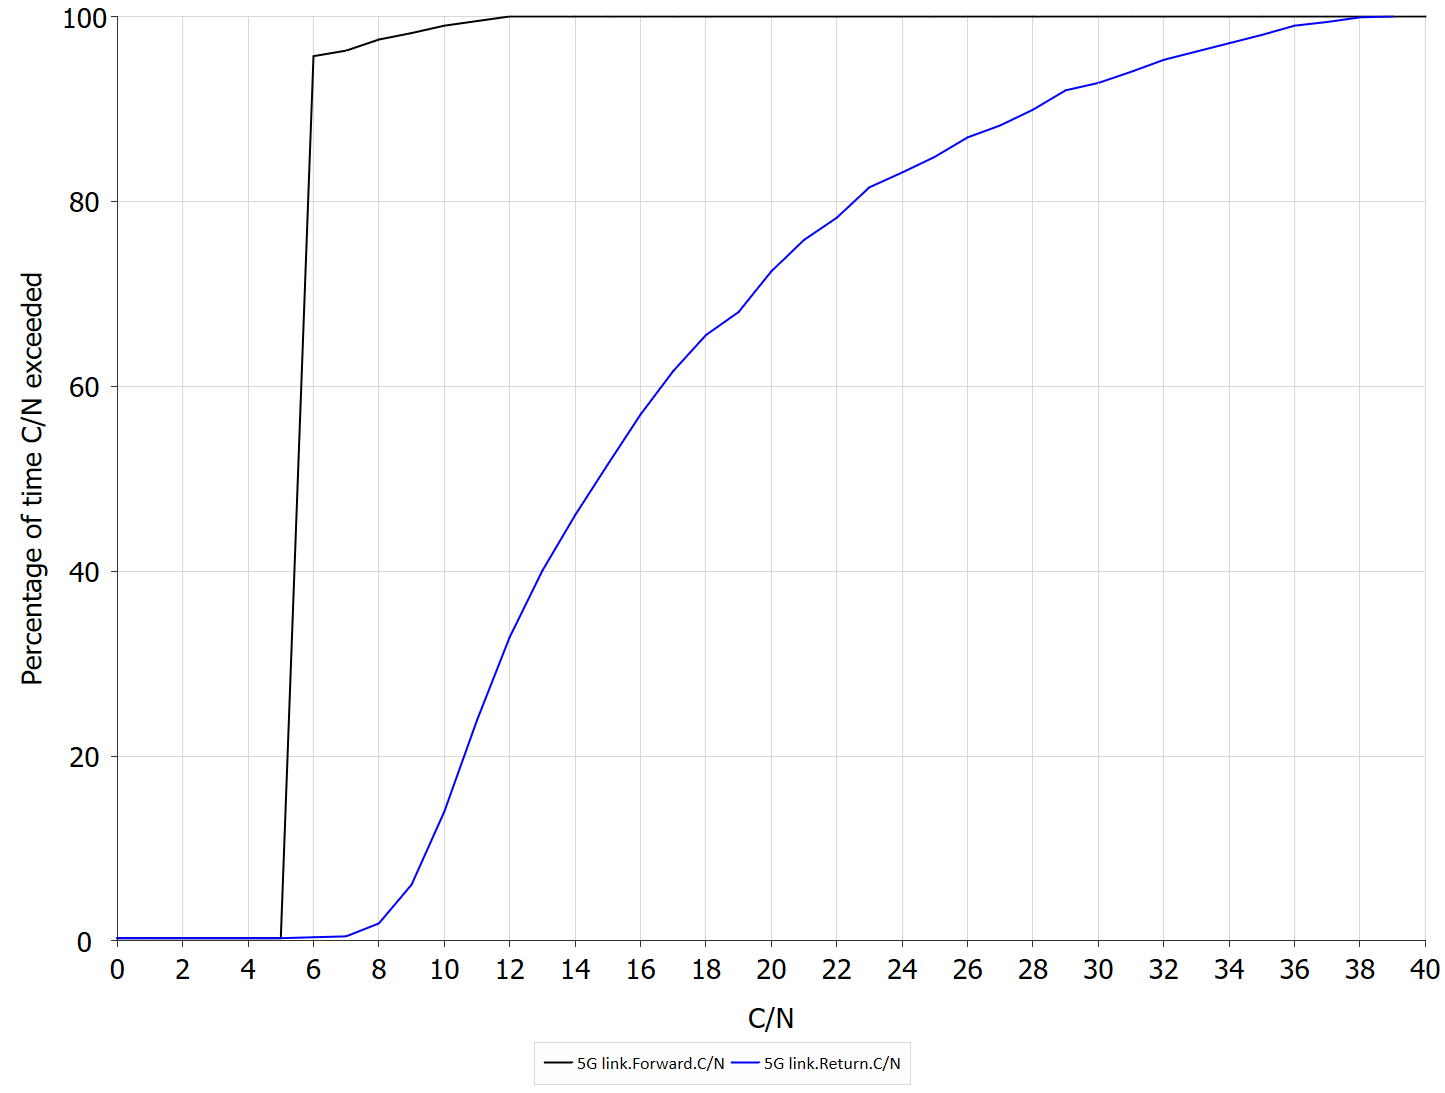
For these link parameters and the constellation described in the previous section, the C/Ns for the uplink (UL) and downlink (DL) were generated as in the following figures for one simulated day with a time step of 1 second:
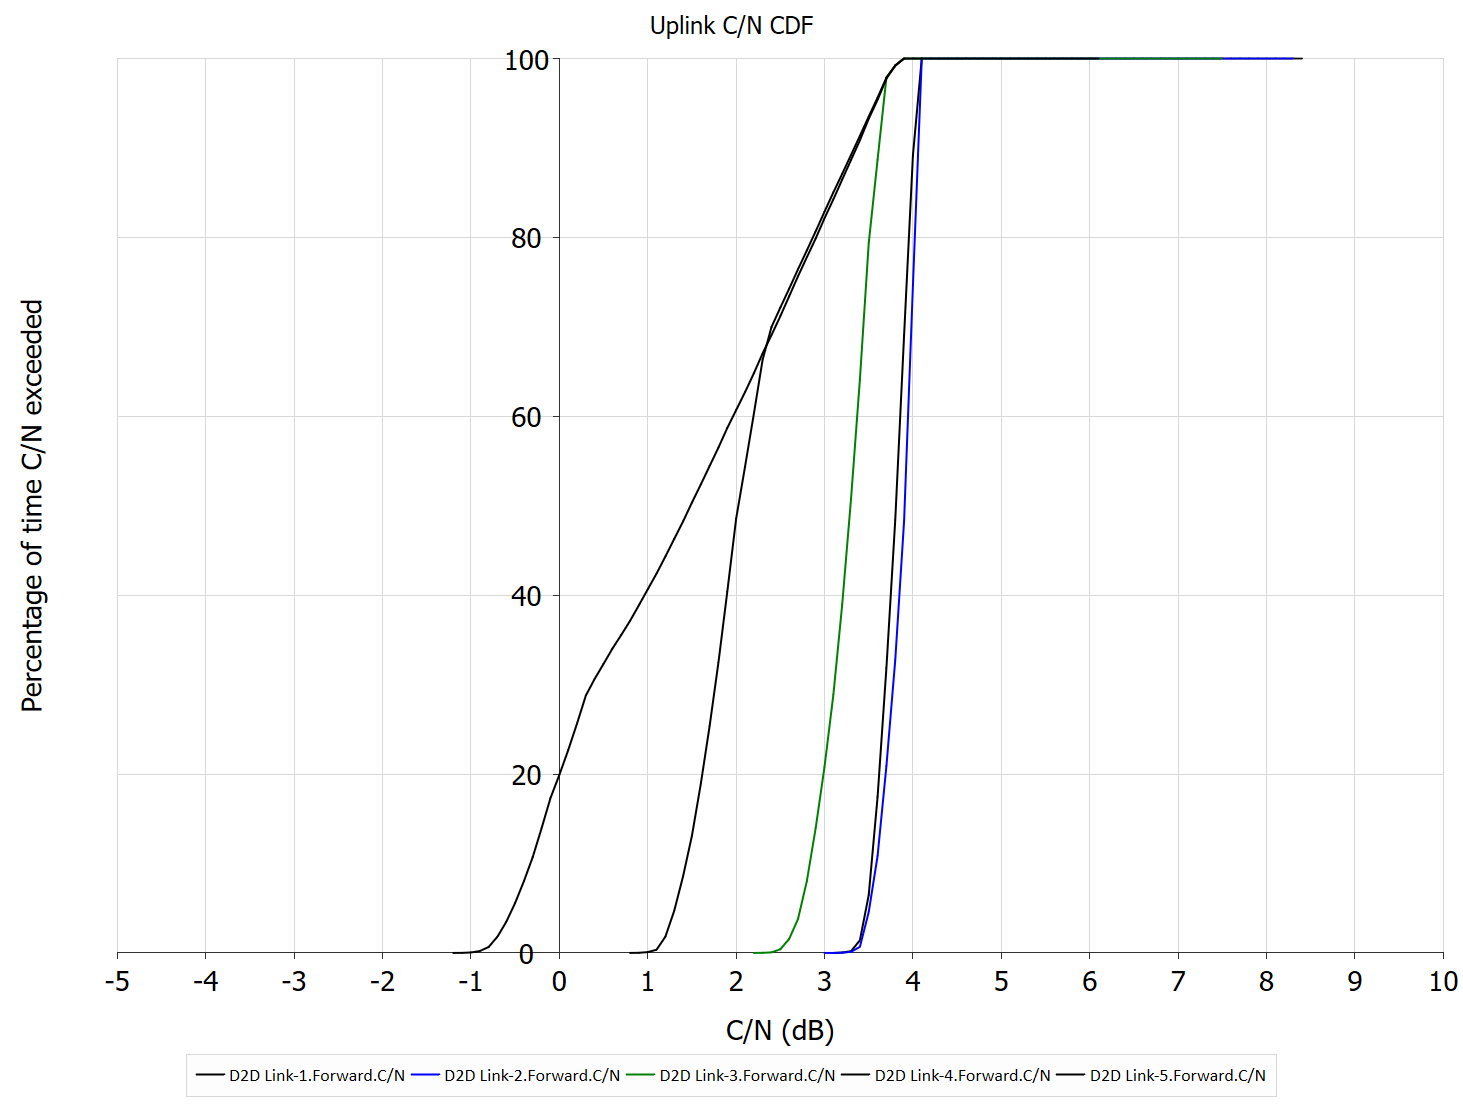
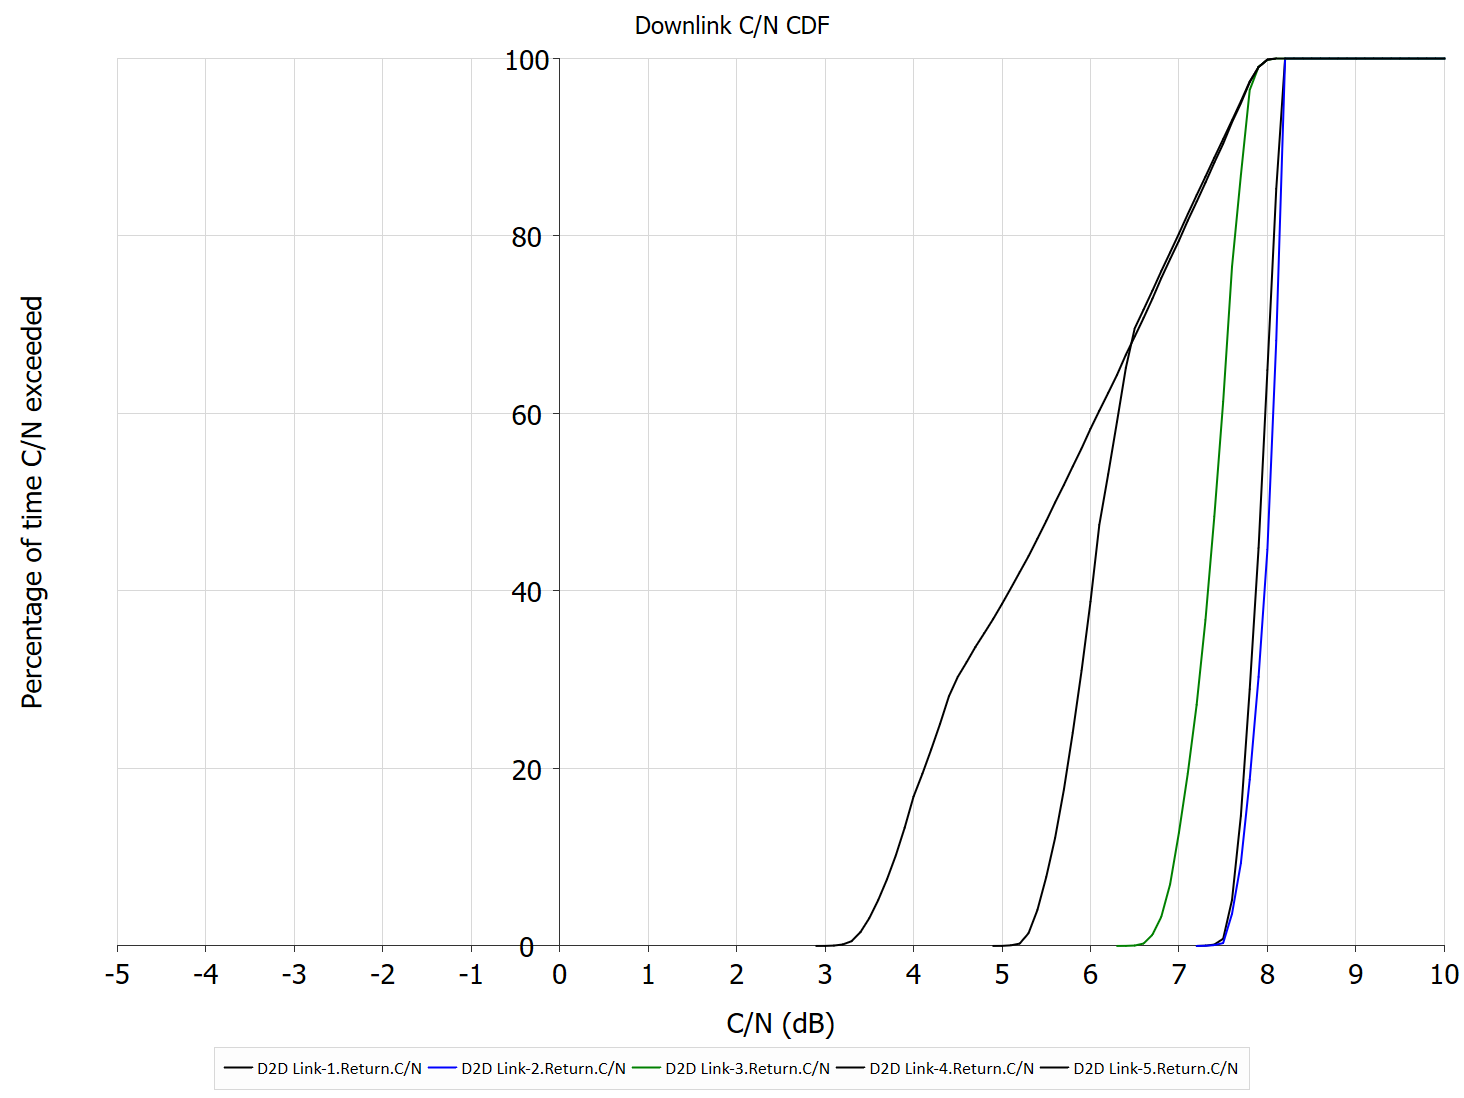
The following can be seen:
- The downlink C/Ns are generally higher than the uplink C/Ns due to the availability of higher power at the satellite, despite the downlink bandwidth being wider than that for the uplink
- The C/N CDFs are better at the lower latitudes than higher as the path lengths to the satellite are lower.
In this case, in order to provide better coverage above around 56N, there could be benefits in adjusting the non-GSO constellation. This could be done in a number of ways:
- Reduce the satellite altitude to reduce the free space path loss to the ground
- Increase the number of satellites visible at these latitudes.
D2D System Design
From this basic link budget study, more detailed analysis could be done, such as:
- Intra-system interference study, to identify how close together cells of UEs can operate co-frequency so that a single non-GSO satellite can point beams at both without causing harmful interference
- Capacity analysis, to identify the total capacity of the system, taking into account intra-system interference, power limits at the satellite, link engineering etc.
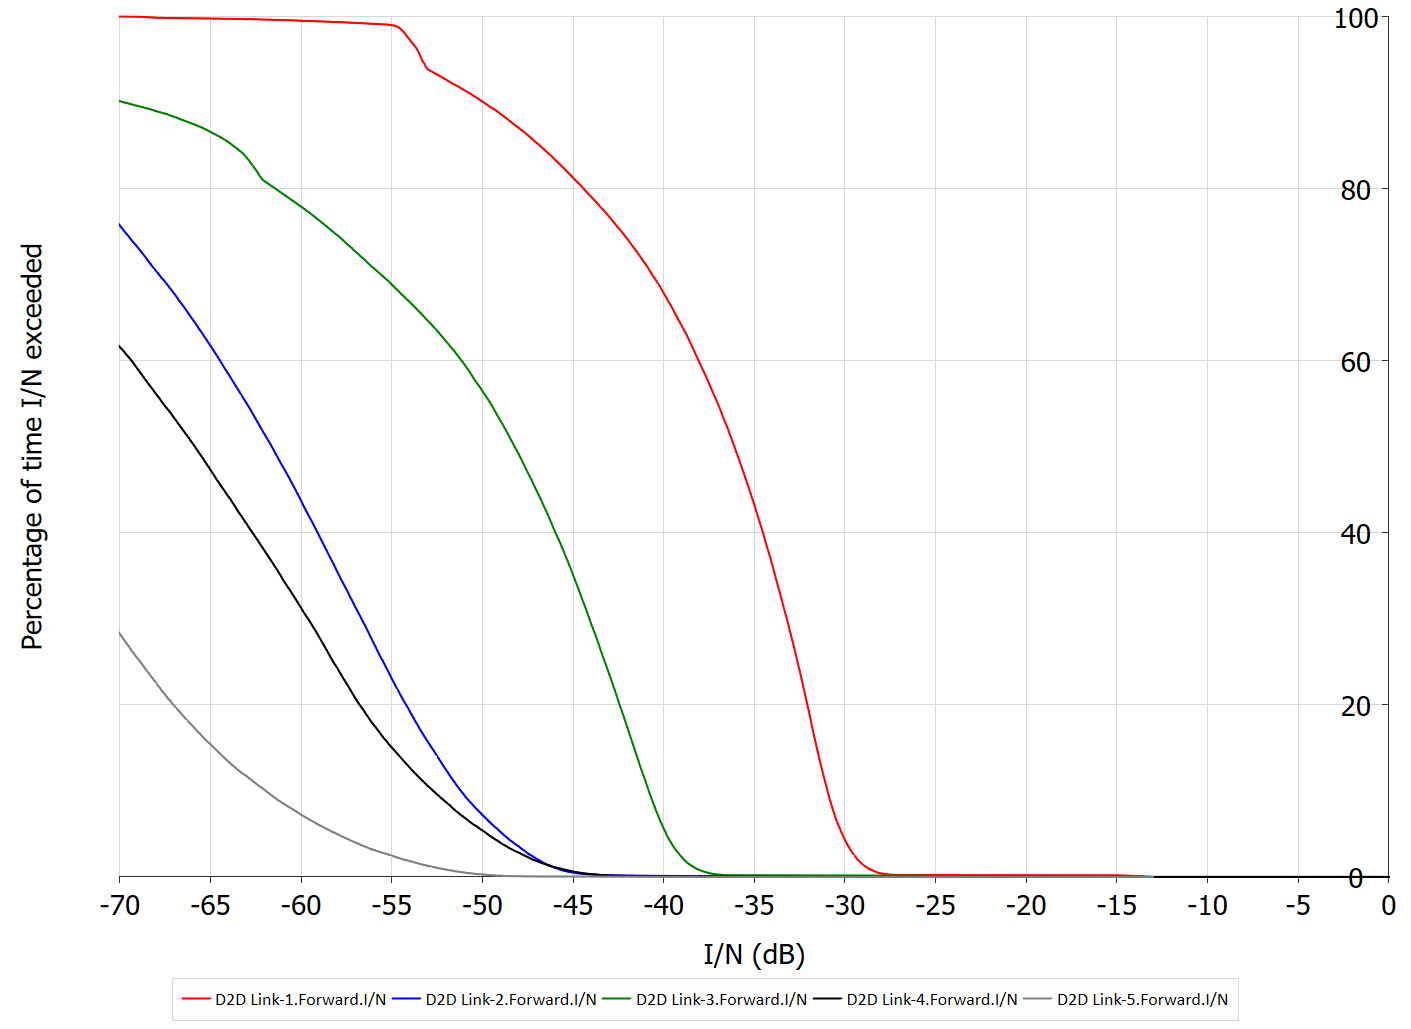
For the scenario above, each of the links were assumed to be co-frequency and causing interference into the others. The resulting C/(N+I) CDFs are shown below:
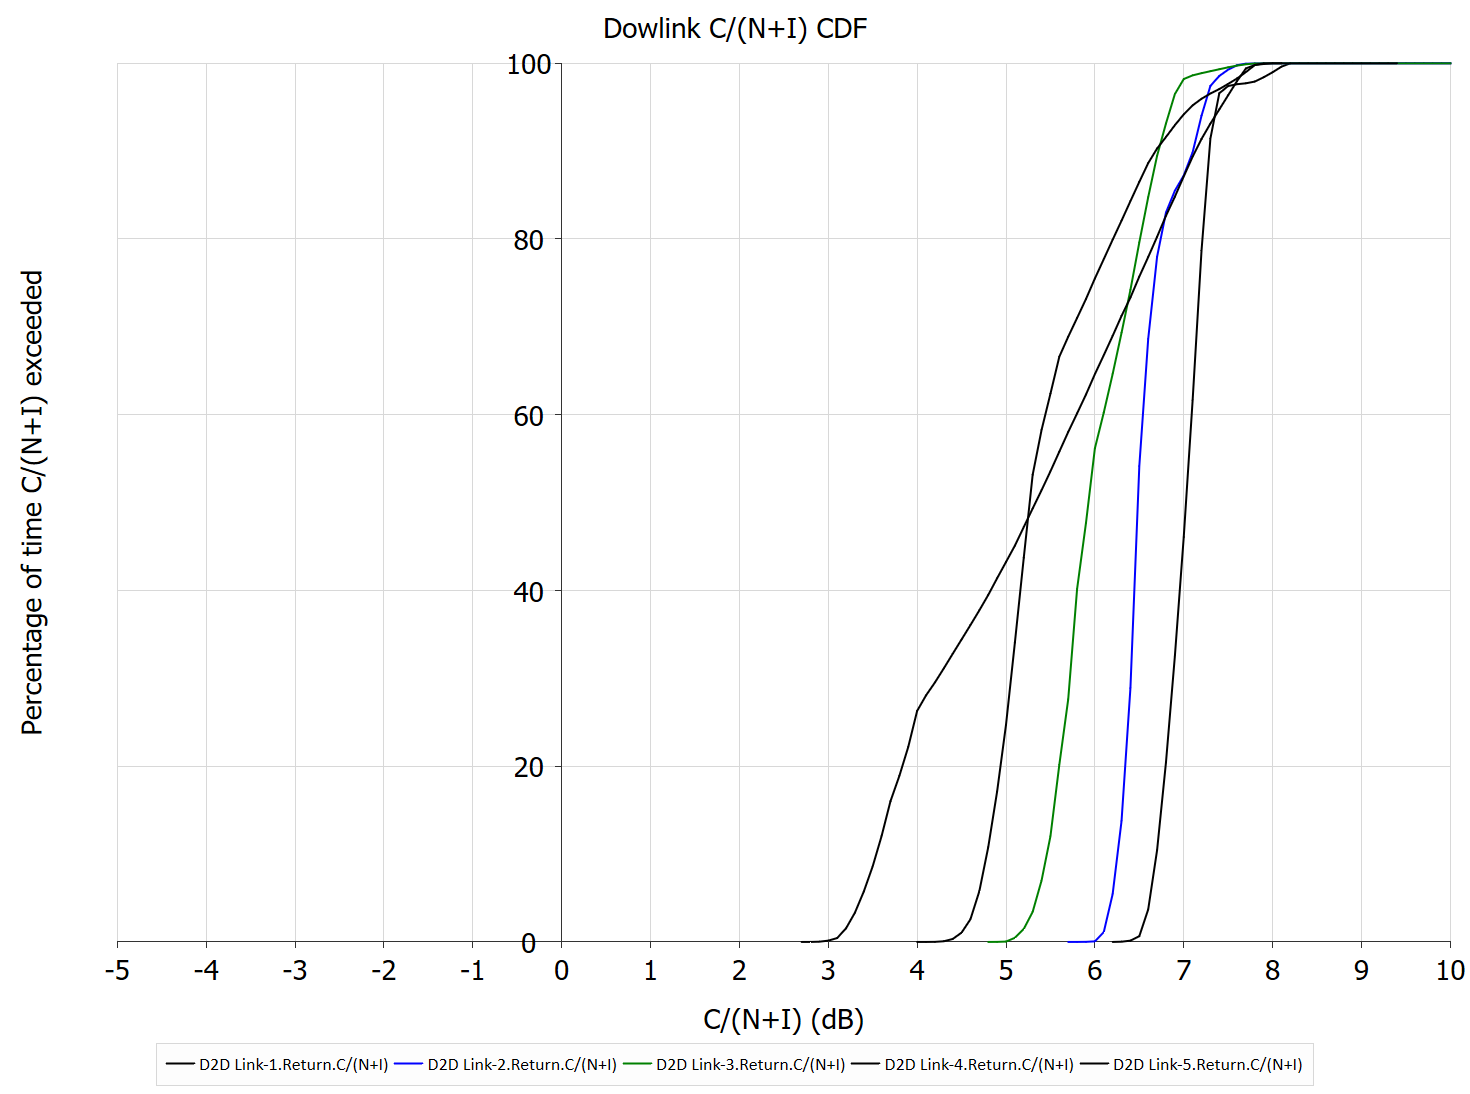
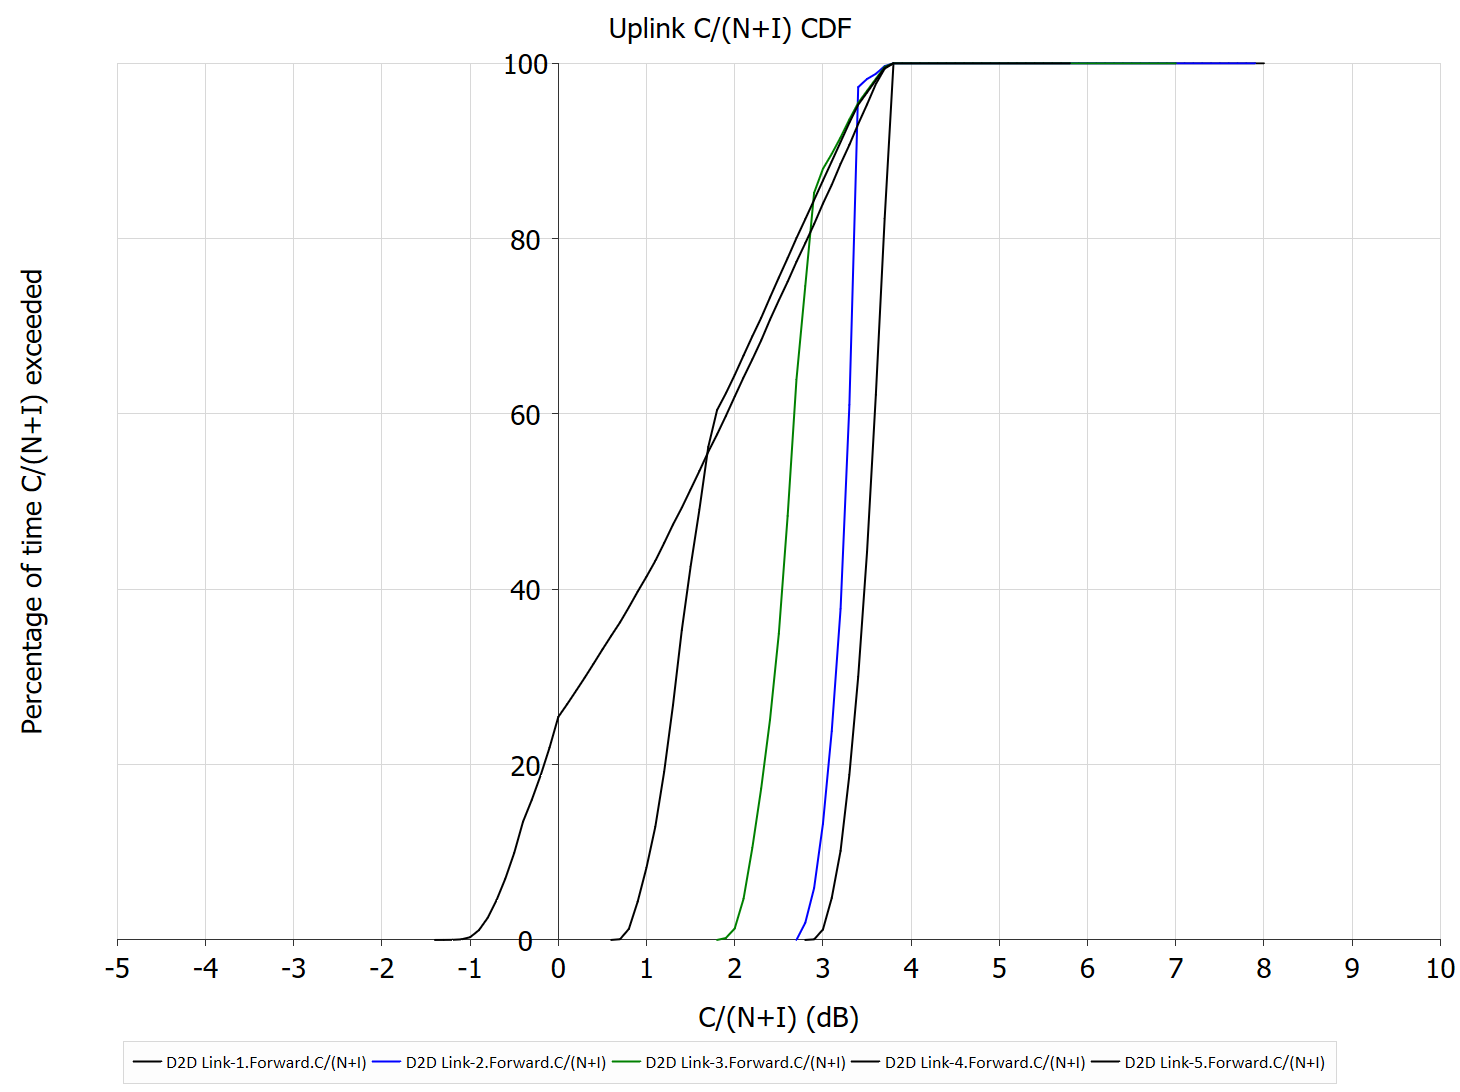
Minor degradations in the C/N due to interference can be seen in the figures above and the table of derived values below:
| Downlink direction | D2D Link-1 | D2D Link-2 | D2D Link-3 | D2D Link-4 | D2D Link-5 |
|---|---|---|---|---|---|
| Worst C/N | 7.2 | 7.2 | 6.3 | 4.9 | 3.0 |
| Worst C/(N+I) | 6.2 | 5.8 | 4.8 | 4.1 | 2.8 |
| Percentage bad steps C/N | 0.0 | 0.0 | 0.0 | 0.0 | 0.0 |
| Percentage bad steps C/(N+I) | 0.0 | 0.0 | 0.0 | 0.0 | 0.0 |
| Throughput calculated using C/N | 162265.0 | 163386.4 | 153809.4 | 137539.2 | 126851.4 |
| Throughput calculated using C/N | 148239.7 | 141189.8 | 133043.5 | 125707.1 | 122605.0 |
| Uplink direction | D2D Link-1 | D2D Link-2 | D2D Link-3 | D2D Link-4 | D2D Link-5 |
|---|---|---|---|---|---|
| Worst C/N | 3.1 | 3.1 | 2.2 | 0.8 | -1.2 |
| Worst C/(N+I) | 2.8 | 2.7 | 1.8 | 0.6 | -1.3 |
| Percentage bad steps C/N | 0.0 | 0.0 | 0.4 | 72.1 | 71.2 |
| Percentage bad steps C/(N+I) | 0.0 | 0.0 | 34.9 | 75.6 | 73.0 |
| Throughput calculated using C/N | 100376.9 | 101349.7 | 93055.5 | 79035.3 | 69916.3 |
| Throughput calculated using C/(N+I) | 96377.4 | 92470.9 | 84646.7 | 74849.7 | 68728.5 |
More detailed analysis could identify the critical, minimum distance at which the system could no longer provide a service. However, the preferred distance is likely to greater than this, taking into account the balance between:
- Lower distance between co-frequency beams resulting in higher intra-system interference (and hence lower spectrum efficiency per beam) but allowing more beams (hence potentially greater spectrum efficiency overall)
- Greater distance between co-frequency beams resulting in lower intra-system interference (and hence higher spectrum efficiency per beam) but also fewer beams (hence potentially lower spectrum efficiency overall).
This analysis could be extended to derive throughput metrics for the constellation providing a service to a specific region, and hence alternative configurations considered, such as:
- Orbit height(s)
- Orbit inclination(s)
- Number of satellites
- Satellite antenna size / gain / number of elements
- Etc.
Sharing with Terrestrial Services
Scenario of Interest
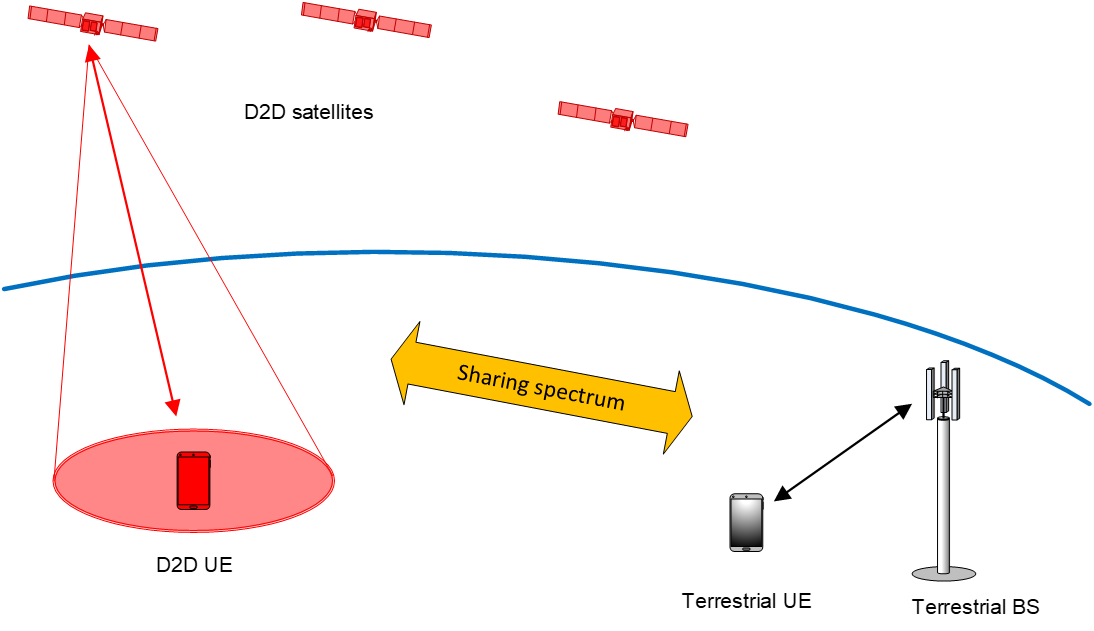
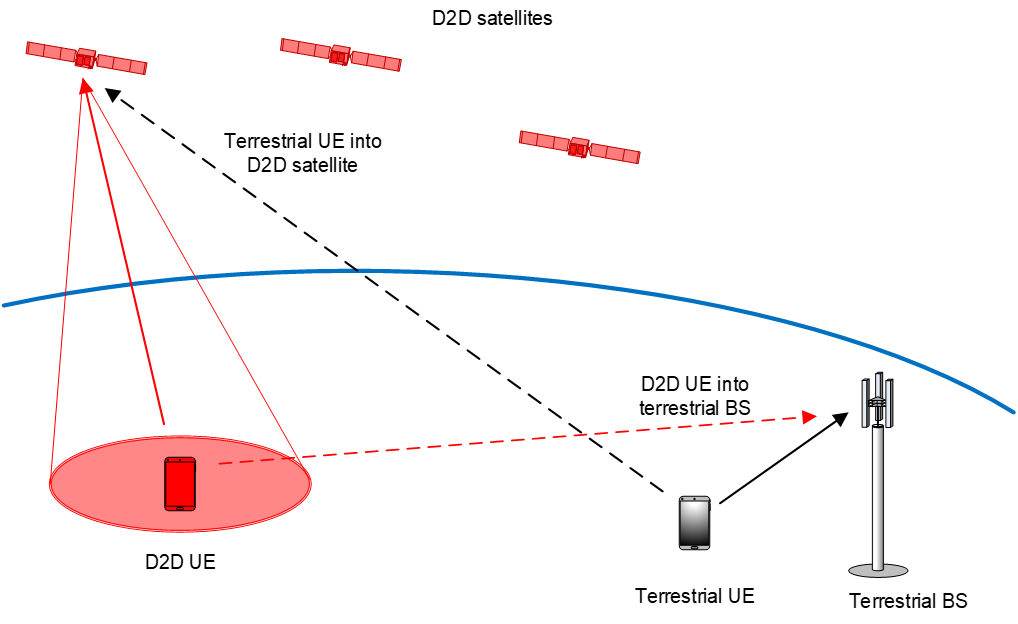
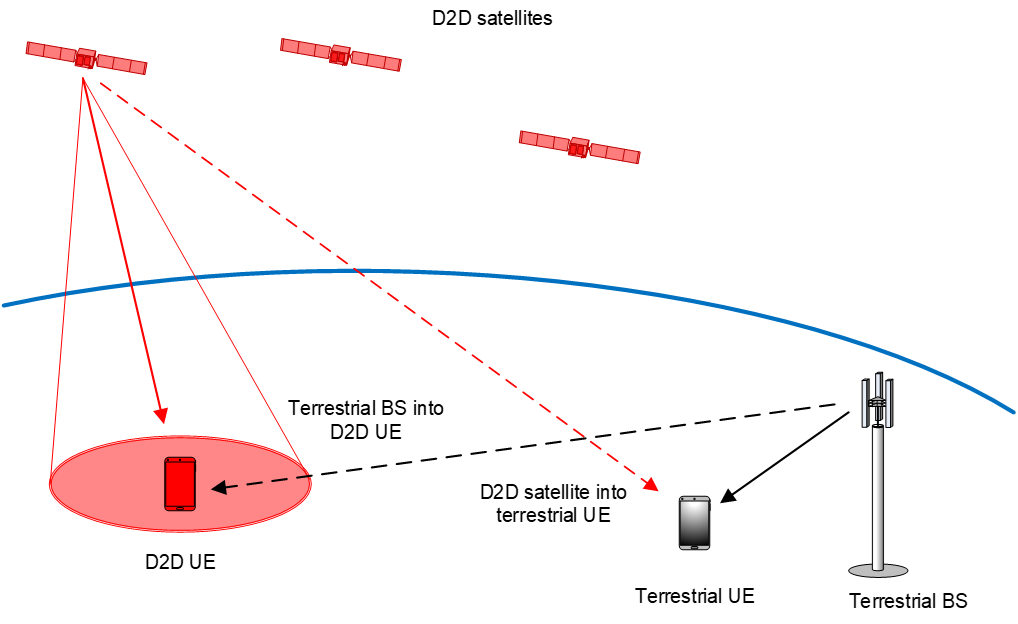
Some D2D systems propose to use spectrum licensed to terrestrial mobile systems. This could lead to co-frequency spectrum sharing, as in the figure below:
One question would be the mode of operation used by each system, which could be:
- Frequency division duplex (FDD), same direction used by the two systems
- FDD, opposite directions used by the two systems
- Time division duplex (TDD) by both systems at the same time
- … or some combination of FDD and TDD between the two systems.
All of these options could be considered and modelled in the Visualyse suite of tools.
In the sections below we’ll consider the FDD (same direction) case. It can be seen there are a number of interference paths to consider:
| Uplink: | 1a. From D2D UE into terrestrial BS | (terrestrial path) |
| 1b. From terrestrial UE into D2D satellite | (Earth-to-space path) | |
| Downlink: | 2a. From D2D satellite into terrestrial UE | (space-to-Earth path) |
| 2b. From terrestrial BS into D2D UE | (terrestrial path) |
The propagation models used for the interference paths were selected based on path type:
- Terrestrial paths: propagation model in Recommendation ITU-R P.2001 using smooth Earth diffraction.
- Space-to-Earth/Earth-to-space: free space path loss plus gaseous attenuation from Recommendation ITU-R P.676.
Modelling the Terrestrial Mobile System
Initially, let’s consider just a single terrestrial mobile cell with the following simplified characteristics:
| Direction | UL | DL |
|---|---|---|
| Frequency (MHz) | 1900 | 2100 |
| Bandwidth (MHz) | 20 | 20 |
| Power control | Yes | No |
| Max Tx power (dBW) | -7 | -20 |
| Tx peak gain (dBi) | 0 | 17 |
| Tx gain pattern | Isotropic | Parabolic |
| Rx peak gain (dBi) | 17 | 0 |
| Rx gain pattern | Parabolic | Isotropic |
| Rx noise (K) | 2900 | 2900 |
| Tr(C/N) (dB) | 2.5 | 2.5 |
The propagation model for the wanted signal was Hata (open) with 4 dB of additional losses with the UE modelled at random across a service area of radius 500m. The resulting C/N CDFs are shown in the figure below.
Uplink Sharing Scenario
The co-frequency FDD uplink sharing scenario is shown in the figure below.
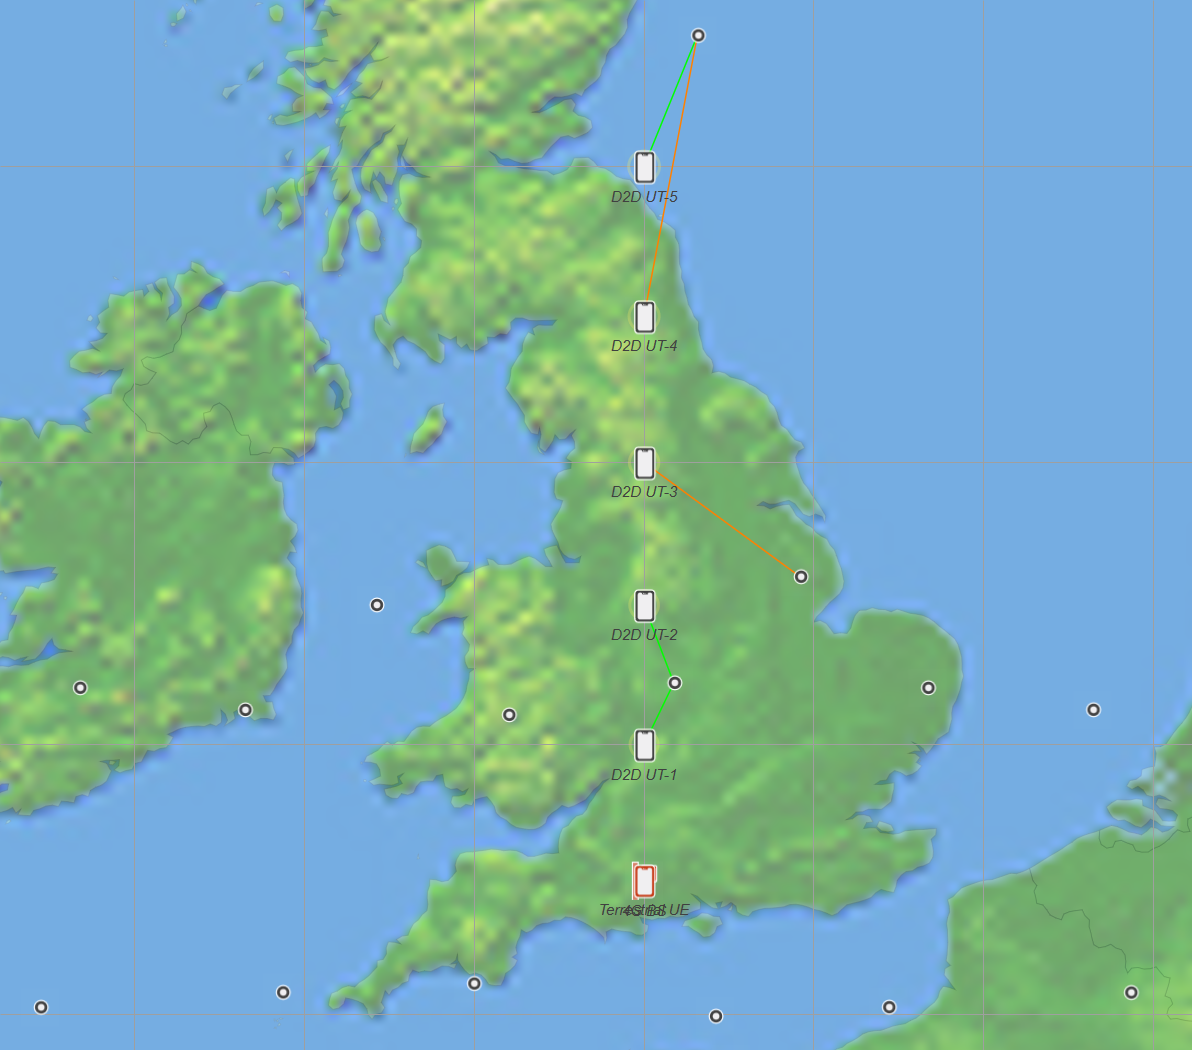
In the Visualyse simulation, all ground stations were located at the same longitude but separated by 1 degree in latitude as in the following figure.
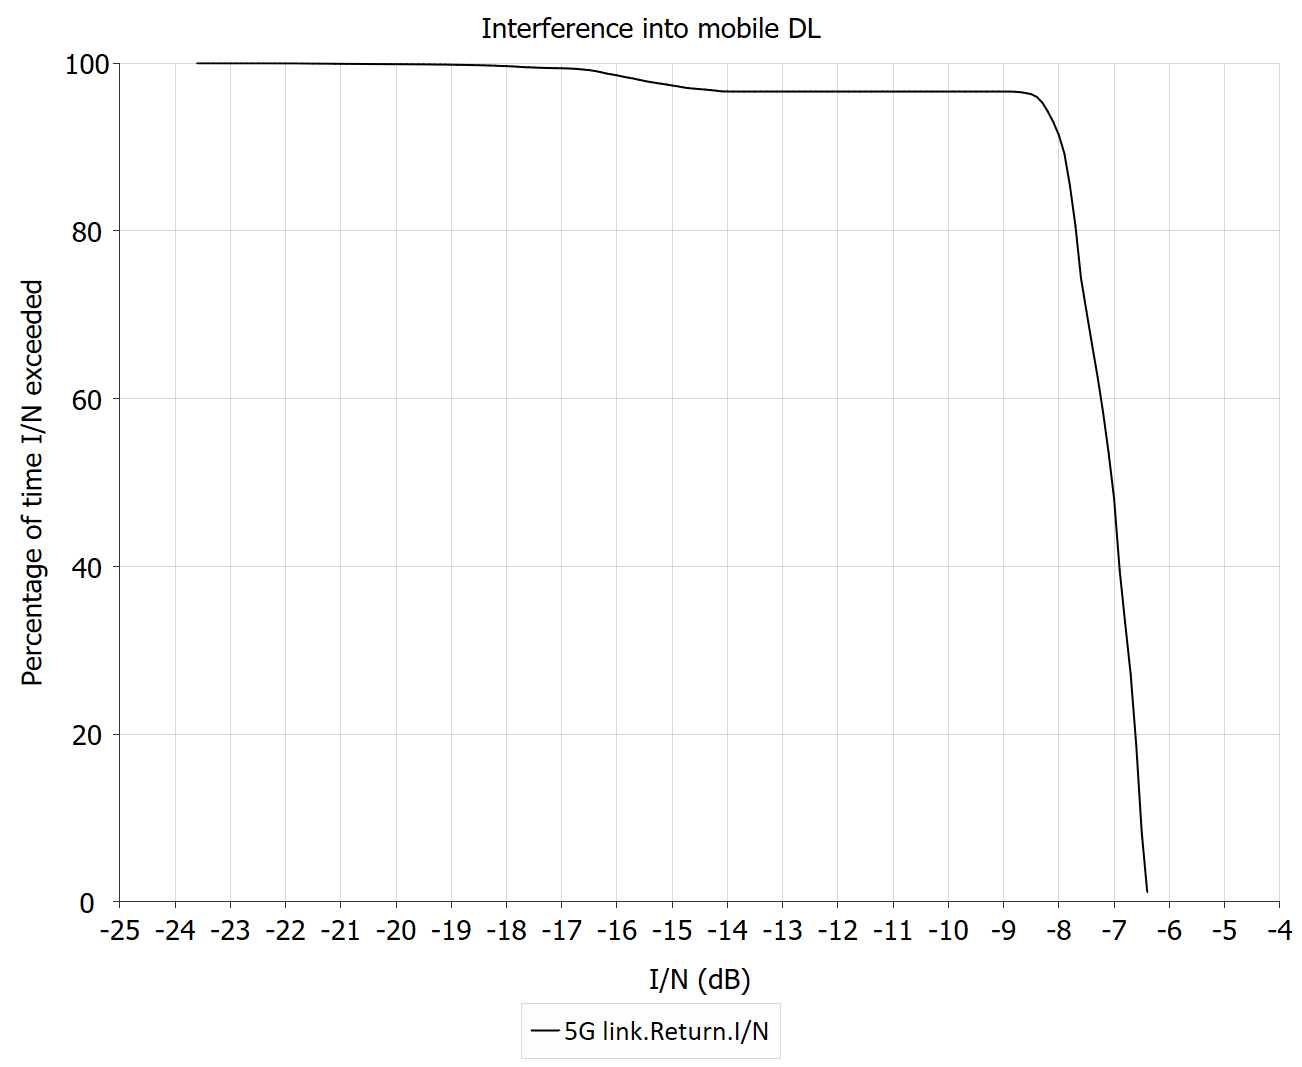
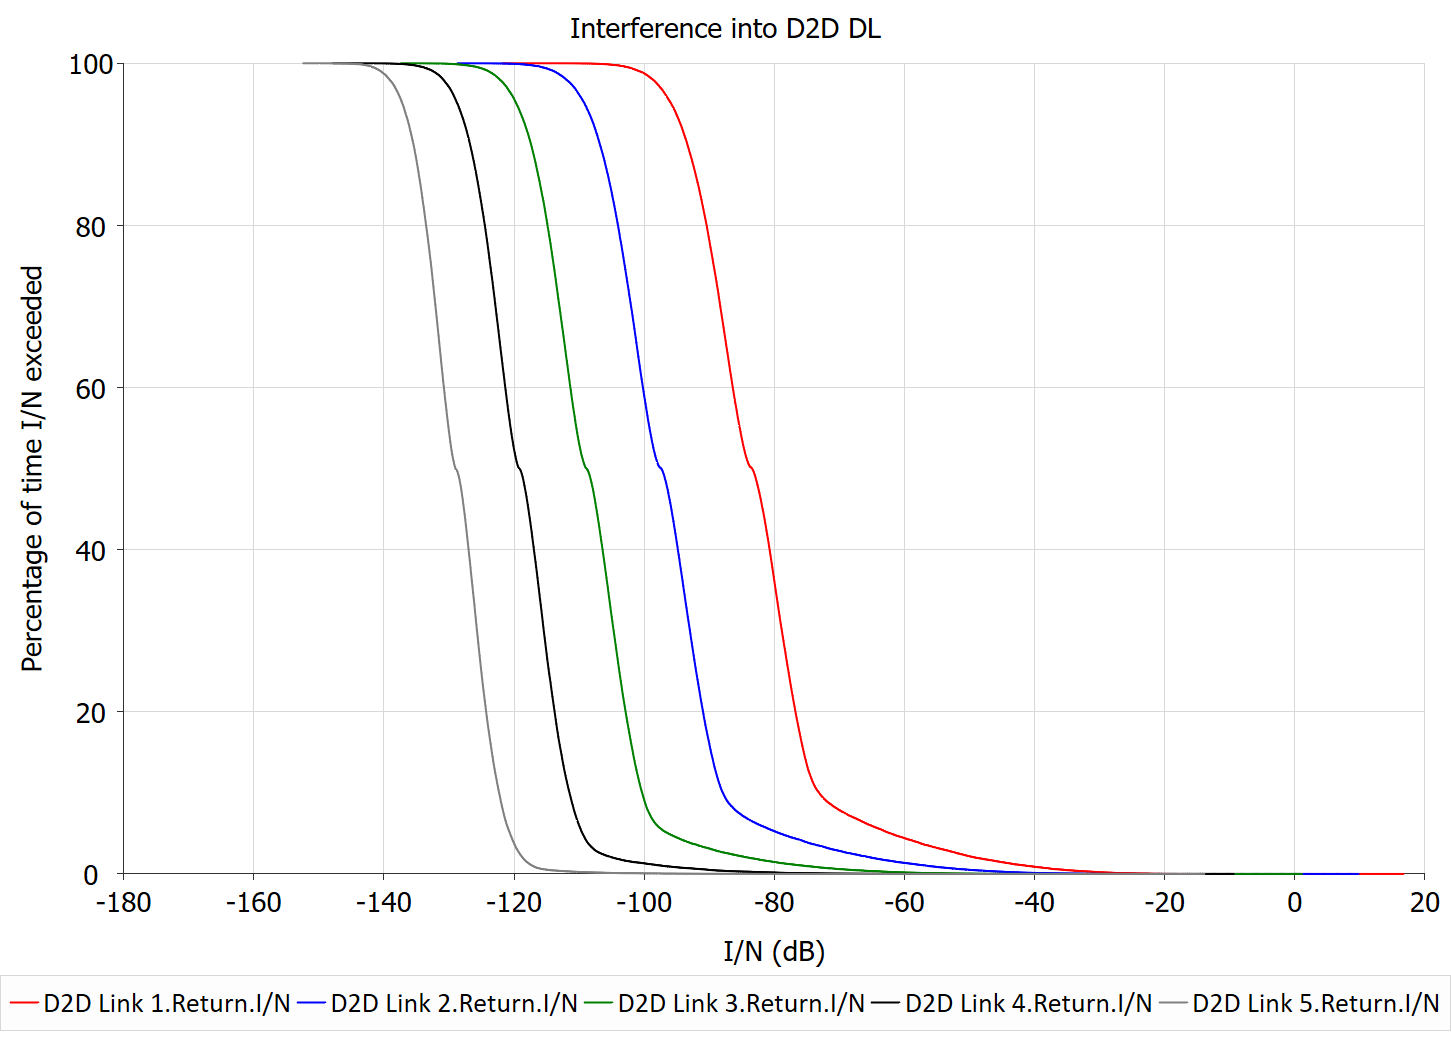
The interference into the terrestrial mobile was the aggregate from all the D2D links. The analysis measured link performance using the {C/N, C/(N+I), I/N} metrics. The I/N Complementary CDFs are shown in the figures below:
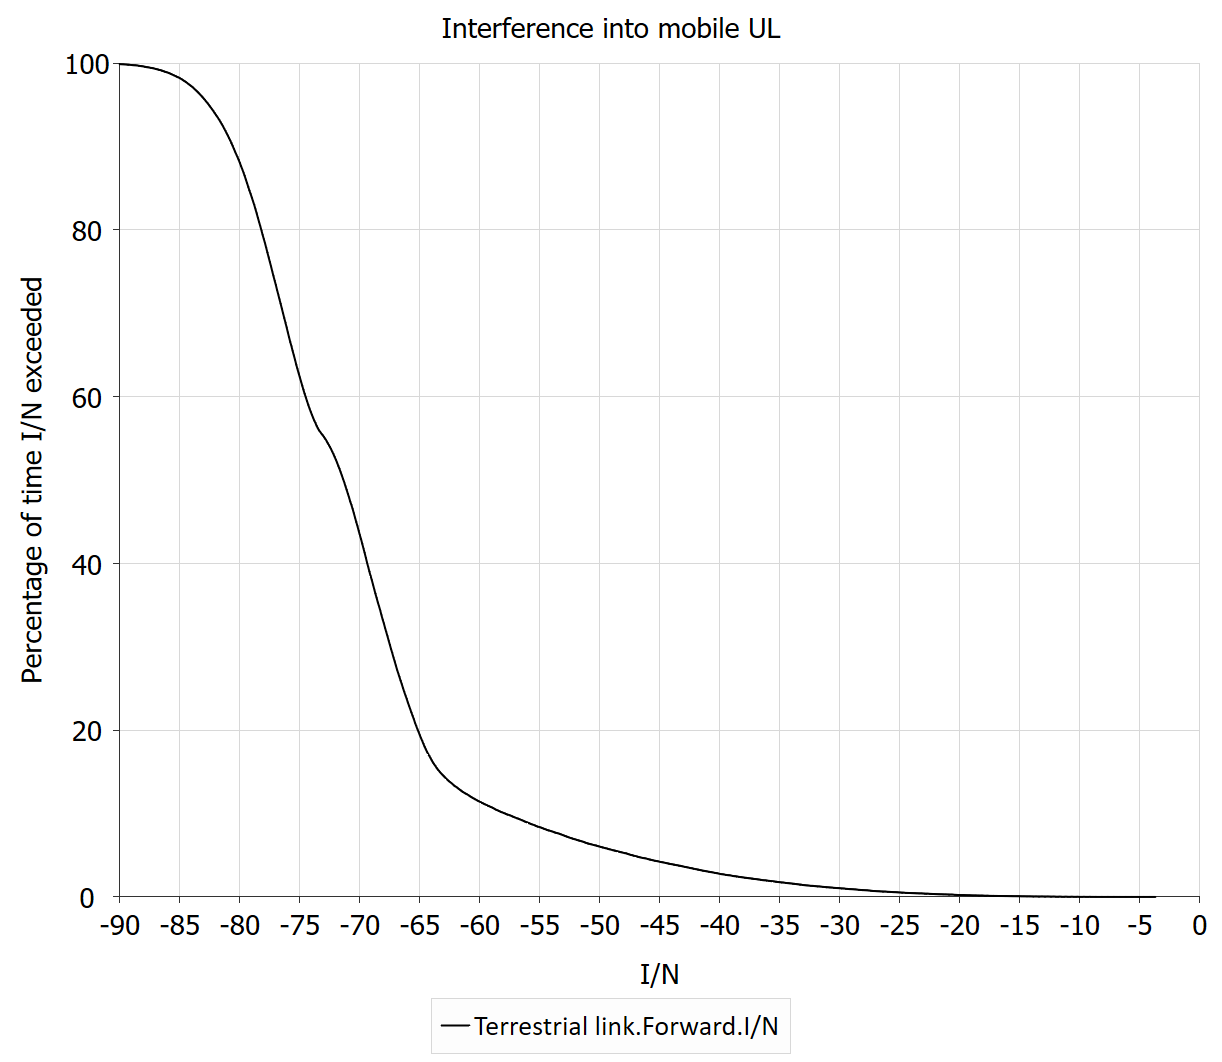
It can be seen that, in general, interference levels are low when the locations are separated by 1 of latitude (around 111.1 km). Interference into the D2D system decreased, the greater the separation distance to the mobile networks.
However:
- The interference into the D2D UL only considered a single terrestrial mobile when in reality there could be thousands if not millions transmitting co-frequency. Hence the I/N curve could be 30 or even 60 dB higher.
- There were times when the interference into the terrestrial system was above the Tr(I/N) = - 6 dB due to anomalous propagation conditions. However, this was very rare, close to 0.001% of the time.
More detailed analyses could:
- Consider the aggregation of large numbers of terrestrial systems into satellite ULs (as in the section below).
- Consider the aggregation of multiple D2D UEs into a terrestrial system.
Such analysis would be required to identify the separation distances required to avoid harmful interference.
Downlink Sharing Scenario
The co-frequency FDD downlink sharing scenario is shown in the figure below.
A similar simulation file was used as for the UL case. The I/N plots are shown below.
It can be seen that, in general, interference levels are low when the locations are separated by 1 of latitude (around 111.1 km). Interference into the D2D system decreased, the greater the separation distance to the mobile networks.
Again, the interference into the D2D DL only considered a single terrestrial mobile when in reality there could be thousands if not millions transmitting co-frequency. However, there could be significant propagation loss due to terrain and clutter between the mobile network and the D2D handset.
More detailed analyses could:
- Consider the aggregation of large numbers of terrestrial systems into satellite DLs
- Consider the aggregation of multiple D2D DLs into a terrestrial system.
Such analysis would be required to identify the separation distances required to avoid harmful interference.
Modelling Aggregation
Aggregation can become a significant issue when there are large numbers of transmitters, such as the mobile UL into the D2D UL. In the analysis above, only a single mobile cell was considered, but there could be thousands if not millions. In these cases, it is necessary to undertake an analysis of aggregate interference.
One way to do that in Visualyse Professional is to deploy many stations over an area. As it is not possible to model the tens of thousands, if not millions individually, an approach is used whereby each station in Visualyse represents N actual stations and the power is increased by a factor = 10log10(N).
An example is shown in the simulation below:
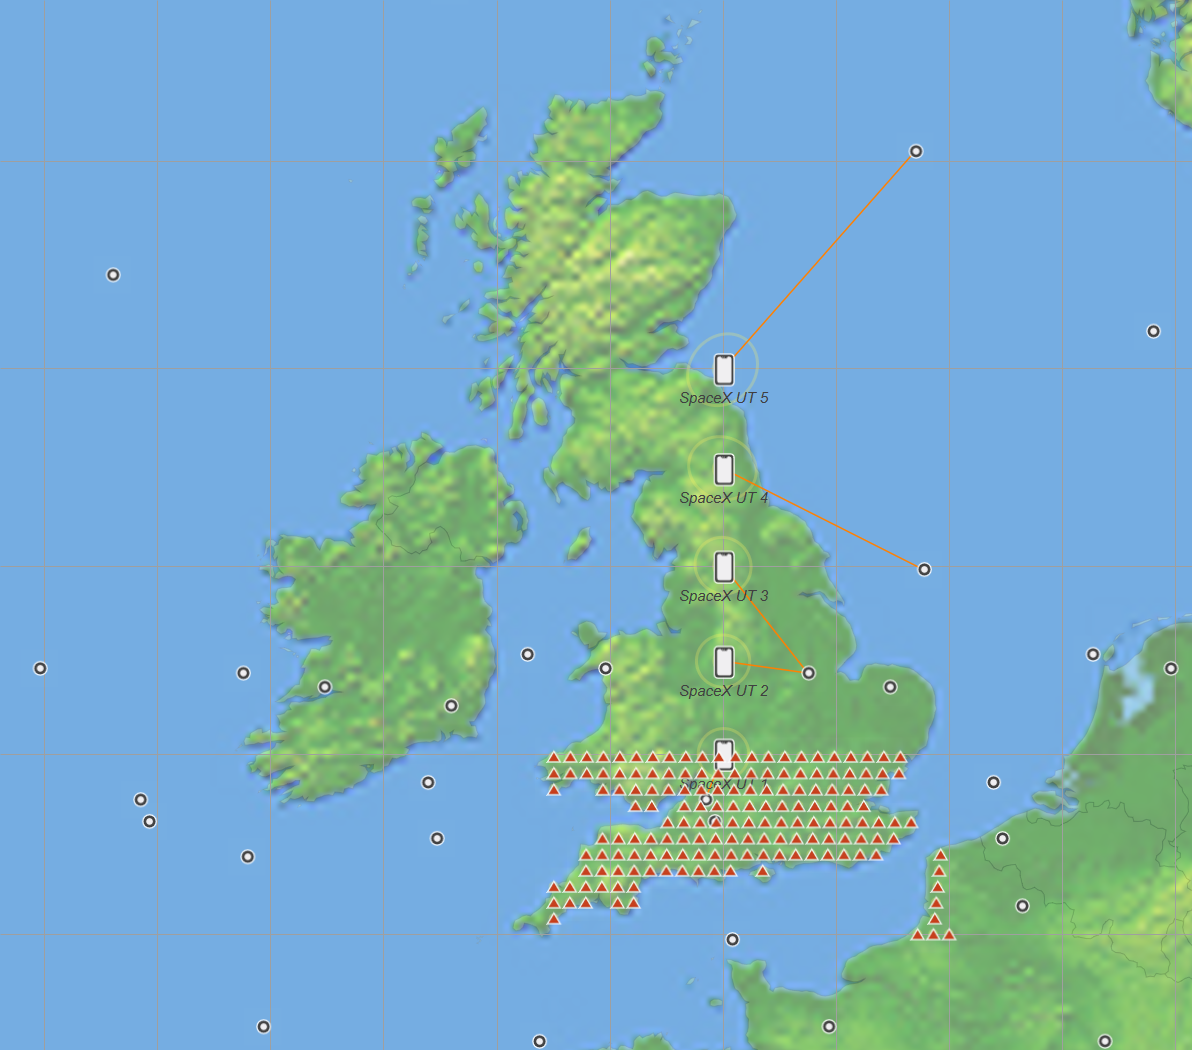
Here, the service area wizard has been used to deploy a grid of 162 stations with separation 20 km across the land mass of England and Wales south of the lowest latitude D2D UE. To avoid the first of the D2D UEs being co-located with some of the terrestrial mobile stations, the array of D2D UEs was moved north 1.
Each test station then represents all the actual UEs within a 20x20 = 400km2 area. Assuming 1,000 UEs within that area, then the transmit power has to be increased by 30 dB. Assuming a power control adjustment factor of -3 dB, the aggregate EIRP per test station was set to 20 dBW. The propagation models were enhanced by use of the P.2108 Earth to space clutter model.
The resulting I/Ns are shown in the figure below.
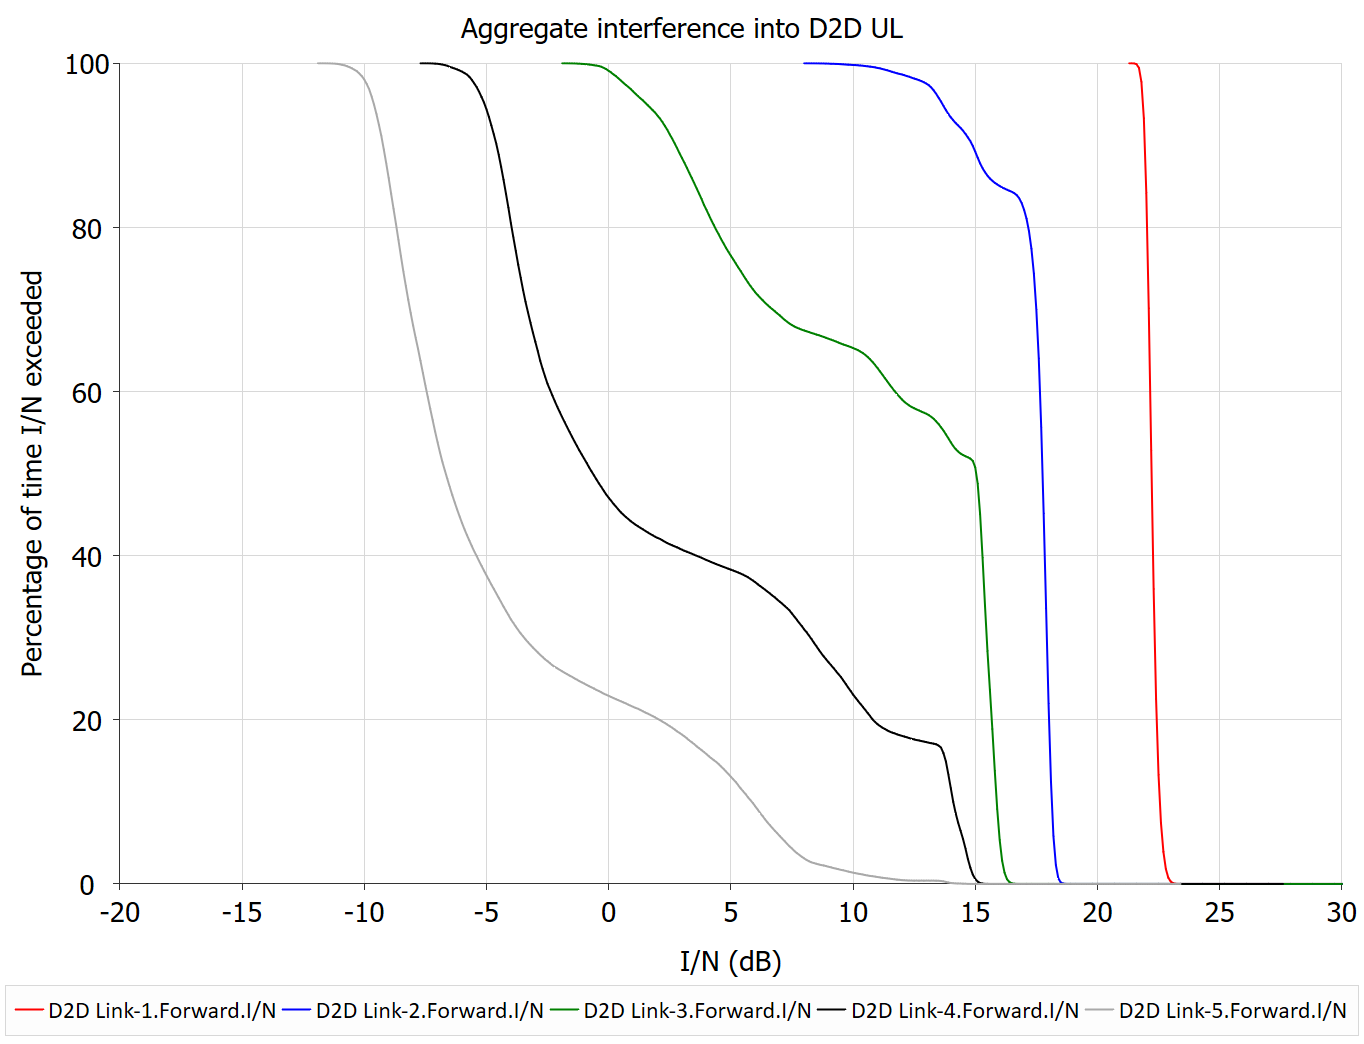
It can be seen that the I/Ns are very high, in particular for those UEs close to the widespread mobile deployment. This could be analysed further, for example:
- The aggregate interference will be significantly affected by the gain pattern at the satellite and so alternatives could be considered e.g. continue to use the gain pattern in M.2101 but with adjusted parameter to reduce the beamwidth or different gain patterns (such as those in Recommendation ITU-R S.1528) etc.
- The aggregate interference decreases with separation distance, so greater distances could be considered.
- The mobile traffic levels also have a significant impact and would need further consideration. For example, the D2D UEs are likely to be deployed in regions with low terrestrial traffic, so there could be a gradual decrease in terrestrial mobile users rather than continuing at a high level until a fixed geographic line. In addition, time of day and other variations in loading could be included in the analysis.
Extending the Analysis
The analysis described above could be extended in wide variety of ways including:
-
Consider a range of alternative parameters and configurations
-
Consider alternative frequency bands
-
Consider narrow-band and internet-of-things (IoT) constellations
-
Consider alternative orbits types, including VLEO, LEO, MEO and GEO.
-
Undertake sensitivity analysis
-
Consider further aggregation cases, including those described above
-
Use the “reference system” approach to modelling aggregate EIRP from an area, as described in our Technical Note
-
Undertaking analysis using C/N and C/(N+I) based metrics and derived parameters such as the increase in unavailability and loss of throughput due to interference
-
Consider alternative scenarios and directions e.g. FDD reverse band, TDD mode etc.
-
Considering alternative services to share with, including but not limited to broadcasting, fixed, space science and radio astronomy
-
Considering non-co-frequency scenarios as well as co-frequency scenarios
-
Undertaking more detailed Monte Carlo analysis that includes traffic factors
-
Analysing the PFD generated by non-GSO constellations and considering the options for PFD limits (by elevation angle, along geographic borders etc.)
-
Considering additional factors including Doppler (using Visualyse Interplanetary)
-
Considering alternative regulatory solutions such as whether MSS spectrum should be used for the D2D UL but that MS spectrum could be used for the D2D DL?
-
Etc.
No doubt these and many other factors will be considered during the WRC cycle!
As well as undertaking studies for WRC agenda items, there will be other requirements for studies, such as:
- Coordination studies: to coordinate a new D2D constellation with other existing filings
- National regulation: D2D system would require national licensing and if using spectrum licensed to terrestrial operators, will have to provide evidence that their operation would not cause them harmful interference
- Spectrum sharing methodologies: how to improve spectrum sharing so that a terrestrial operator could also use their spectrum for D2D systems most effectively.
With help of the Visualyse suite of tools, those with an interest in this subject, whether a non-GSO satellite operator, a terrestrial operator or national regulatory administration, can achieve their regulatory objectives.