
16
Apr
Introduction
Portions of the frequency band 3.7 - 4.2 GHz has been reallocated to flexible use including 5G applications. This is close in frequency to the 4.2 - 4.4 GHz band used by radar altimeters on civil aircraft, which is a critical application involving safety of life. Recently there has been concern of the potential of harmful interference from 5G systems into these radar altimeters, in particular when aircrafts are near airports at lower heights close to terrestrial transmitters.
One solution would be to restrict deployment of 5G systems, limiting the frequencies and locations at which they could transmit. However, there is also strong interest in high-speed mobile broadband services as can be provided by 5G systems. It is interest of all to find a solution that facilitates use of 5G while protecting radar altimeters as this will ensure reliable services and improved spectrum efficiency.
To find a solution it is necessary to understand the spectrum sharing scenario and identify possible solutions. To do this it is important to model all the relevant details of both the 5G interferer and victim radar altimeter. In both cases there are different levels of detail that could be included - but what details should be included and what is the impact of including or not including them?
This White Paper looks at how to model these systems and what is the impact of the level of detail. It shows how making simplified assumptions can make it appear like there is a greater problem of interference than would be identified using more detailed analysis.
Scenario to Model
So how do we model interference from 5G into radar altimeters? Let's start by considering each system and then the scenario involved.
Modelling 5G Systems
The figure below shows an example 5G cell:
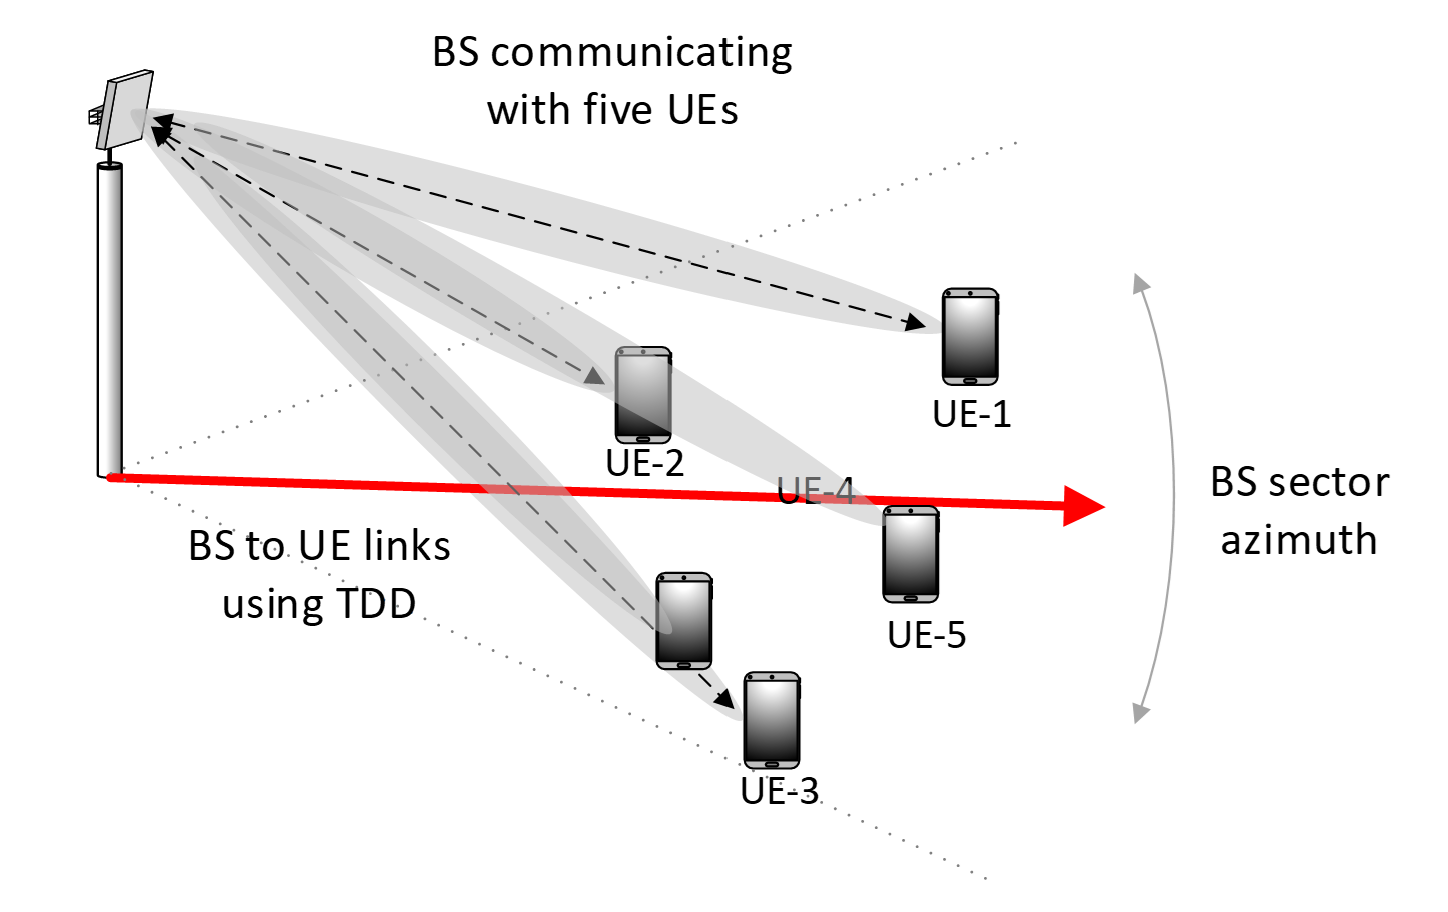
In this cell there is a base station (BS) providing communication services to a set of user equipment (UEs), typically mobile handsets, within its service area or cell. The BS is using a beamforming antenna that generates a highly directional gain pattern in the direction of the UE that it is transmitting towards or receiving from. The gain pattern looks like the figure below, in that there are a series of peaks and troughs, though the pattern will change as the beam is steered away from physical boresight.
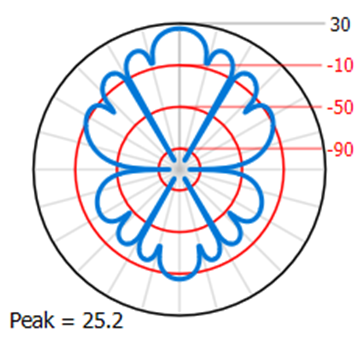
This is the gain pattern of the wanted system at its operating frequency: the gain pattern is likely to be different at other frequencies, and there are a number of ways in which this could be modelled, as discussed later.
The 5G system is operating with the BSUE and UEBS communications operating on the same frequency but at different times, something called Time Division Duplex (TDD). With multiple UEs in a cell, synchronization is used to ensure that all are either transmitting or receiving at the same time, and only one UE transmitting at any time on a given frequency.
As the scenario is not co-frequency, it is necessary to model how the transmit power varies in the frequency domain, to identify how much would be in the victim receiver. The power could also vary - for example, the uplink from the UEBS typically uses power control. Different approaches could be taken here too, as will be covered during the analysis.
Finally, it is also necessary to consider the deployment model, as one of the key aspects of 5G systems is that there could be large numbers of 5G cells within the field of view of an aircraft, and the aggregation of interference should be considered to ensure that the analysis is accurate.
Modelling Radar Altimeters
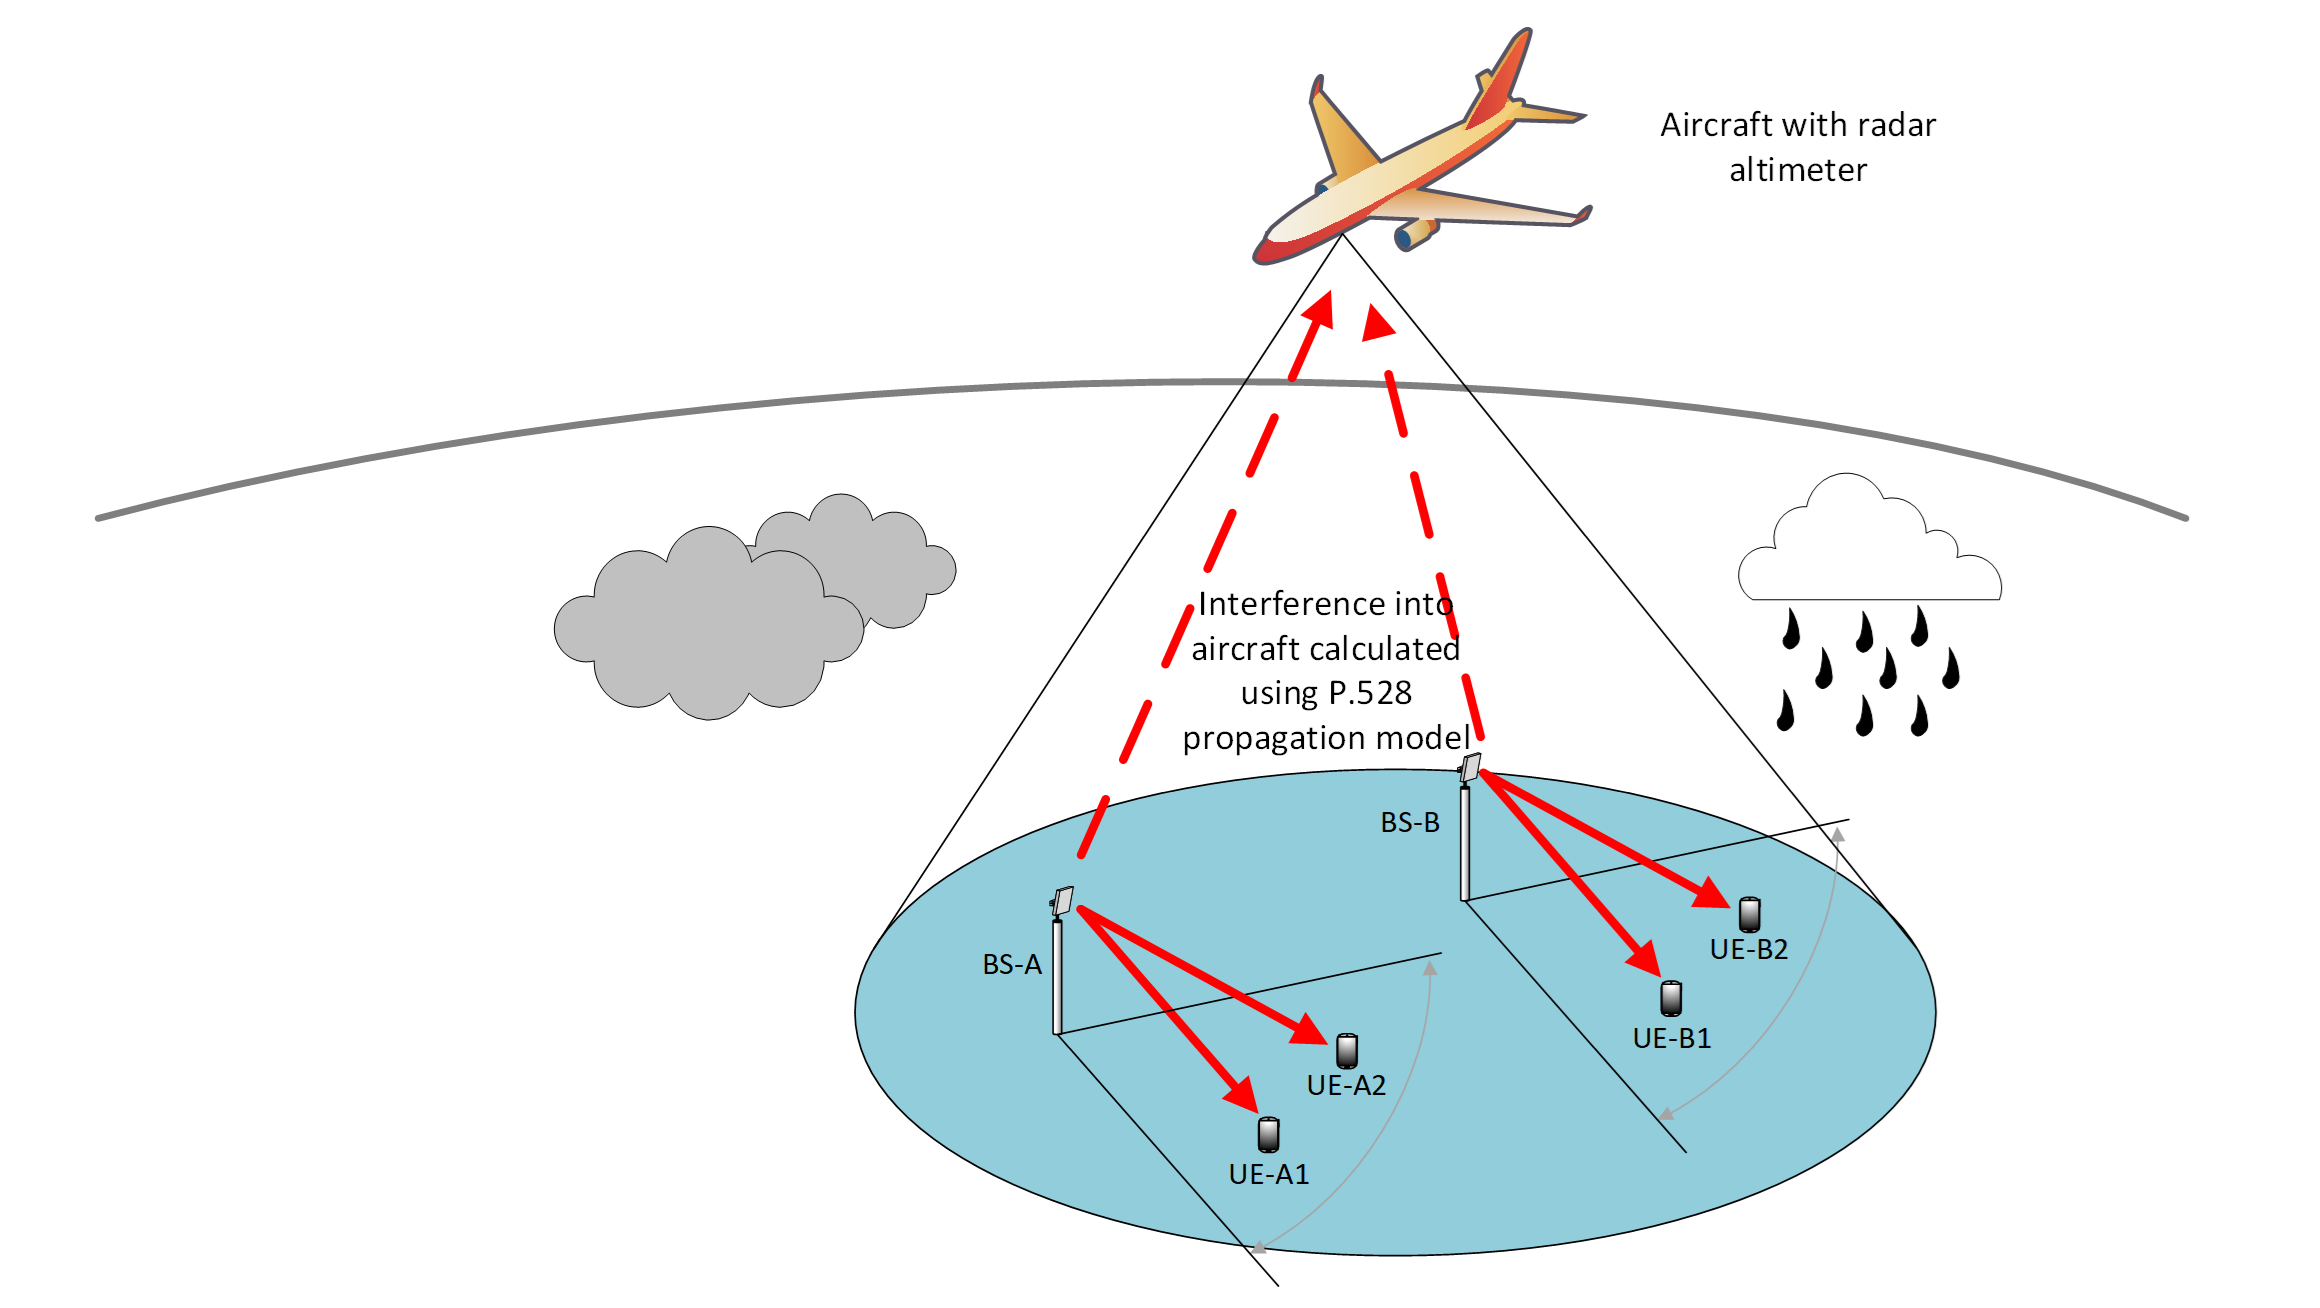
The radar altimeter antenna typically points directly below the aircraft and measures its height above terrain. The key geometry is when the aircraft is at lower altitudes, such as on landing or take-off, as that’s where it is most critical to have reliable height information and the potential for harmful interference from 5G is greatest. Therefore, the scenario to model is then one such as in the figure below when the aircraft is coming down to land:
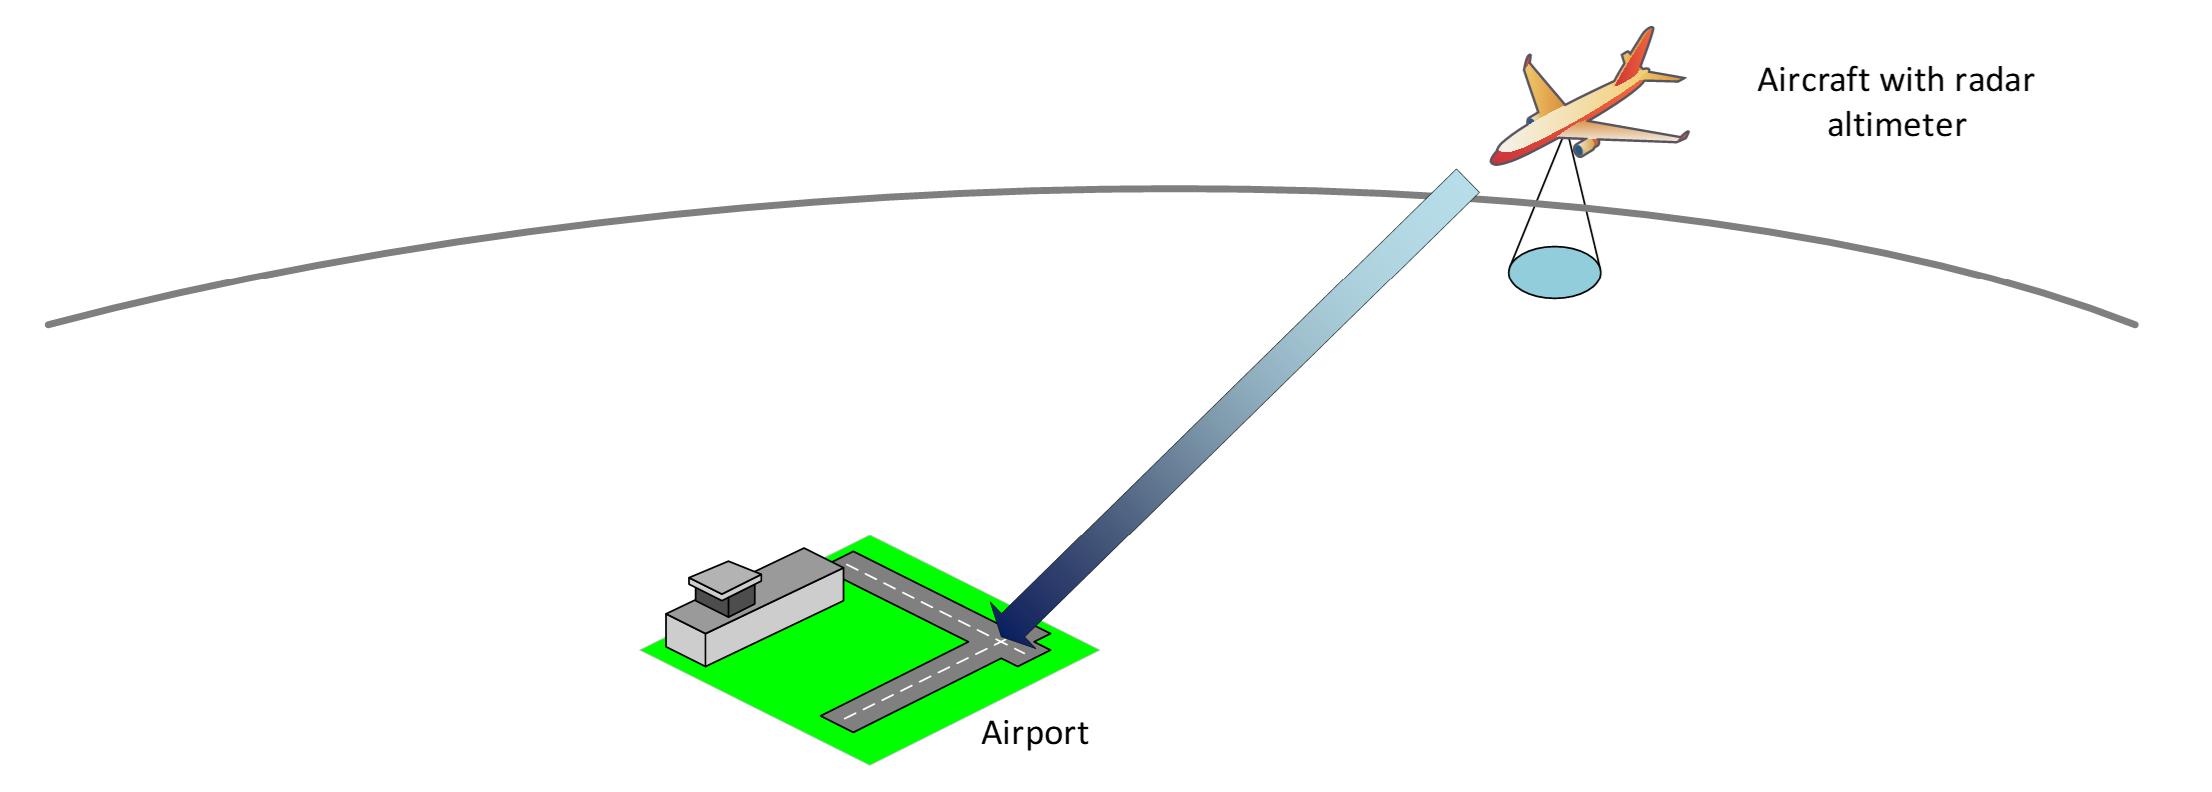
But which height would be most sensitive to interference? This is one of the issues that should be studied, and one way to do that is to undertake a simulation whereby the aircraft is “flown” multiple times on its way into land and the interference calculated along its route.
Sharing Scenario
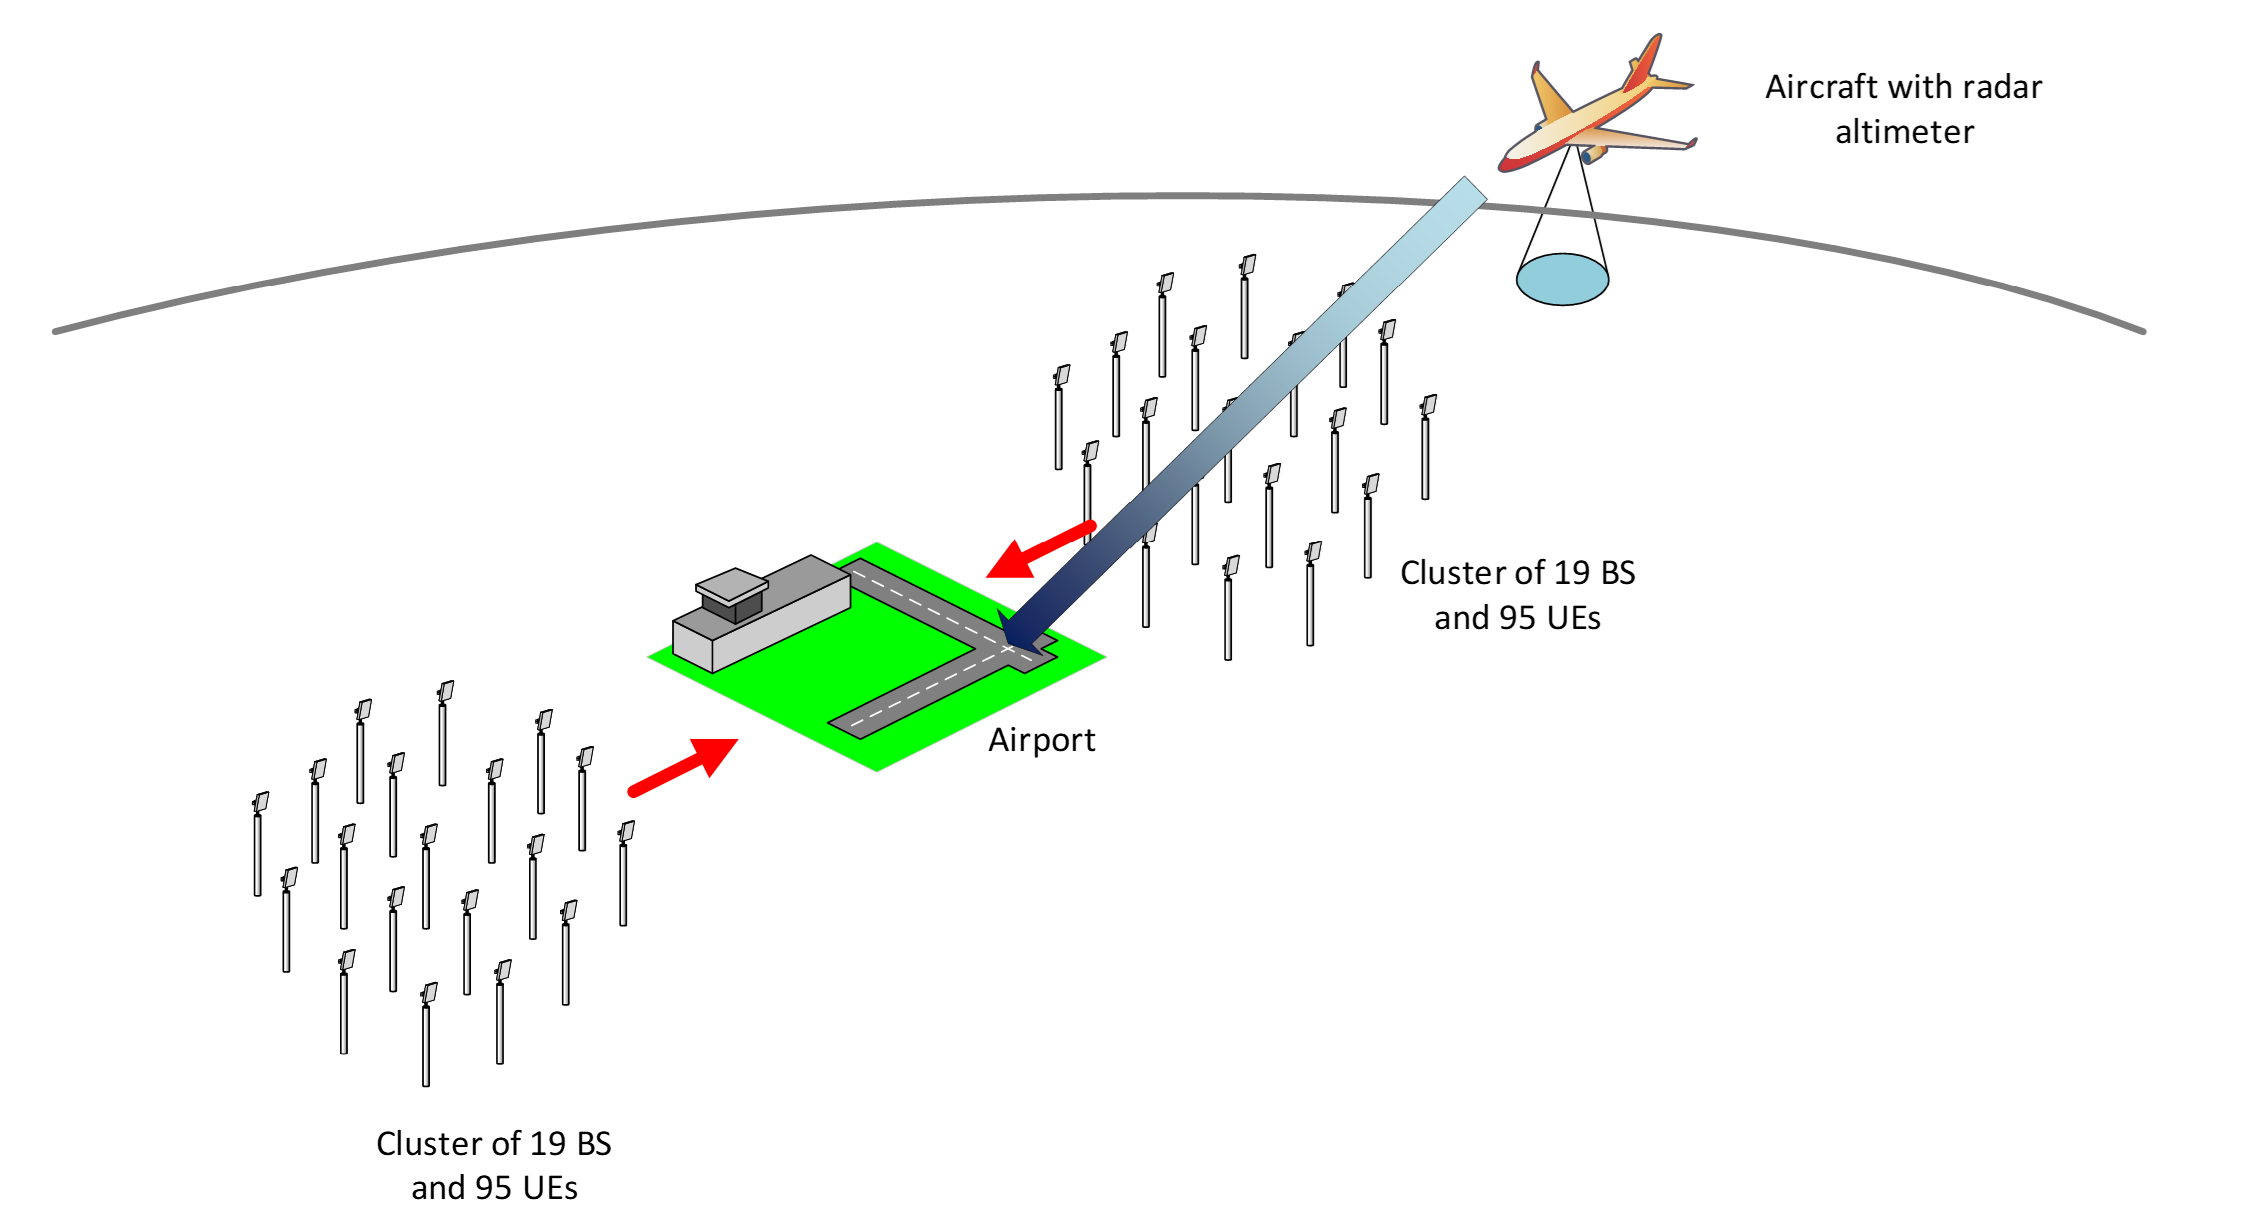
The sharing involving interference from 5G system into radar altimeters was modelled in this White Paper based upon there being two clusters of 5G base stations either side of an airport. An aircraft using the radar altimeter flies over the first cluster while being in the main beam of the second cluster of 5G base stations on the far side of the runway. In each cluster there were 19 base stations with 5 UEs per BS, creating an aggregate interference from 38 BS and 190 UEs.
The interference will be constantly varying, with factors to consider including:
- The aircraft position changing on its route into landing altering the geometry, gains and propagation losses.
- The position of each of the 195 UEs changing within the 5G cell.
- Each of BS antenna’s gain patterns varying as it points towards the relevant UE.
- The power transmitted by each UE varying as it adjusts for varying distance and propagation loss to the BS.
- The direction of the 5G TDD link varying, for example either BS or UE transmitting.
- The propagation loss between the transmitting BS or UE and the aircraft varying by geometry and percentage of time.
This means that the output of the model is not a single interfering signal level, but a distribution of interference that depends upon all the various input models in the simulation. This can be used to identify the likelihood that the system will suffer interference above a given threshold. This type of modelling is often called Monte Carlo modelling.
Level of Detail to Model
The previous section described the two systems and sharing scenario, but when we create a simulation file, we have to make choices about the level of detail we include. Some of the options are described in this section.
5G Gain Patterns
The 5G BS antenna uses arrays of elements to create and steer a beam towards the UE as described in Recommendation ITU-R M.2101. This gain pattern depends on parameters such as number of elements, gain of each element and the ratio of the distance between elements to the wavelength of the signal, known as the D/. As the gain pattern depends upon the wavelength, it will vary in frequency, which is important for this scenario where the victim receiver operates at a different frequency to the transmitter.
For this scenario there are a number of ways to model the gain pattern of the 5G BS towards the aircraft, including:
- Use the gain pattern calculated at the wanted frequency of the 5G system.
- Model the gain pattern of the 5G system at the victim’s frequency via the gain pattern of a single element.
- Model the gain pattern of the 5G system at the victim’s frequency using the full gain pattern but adjusting the D/.
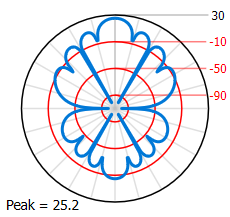
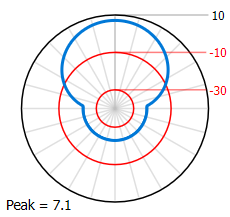
Examples of these gain patterns are shown in the figures below.
 |
 |
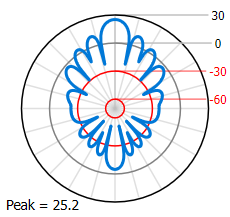 |
| In-band Gain Pattern | Single Element Gain Pattern | Adjacent Band Gain Pattern |
5G Interfering Power
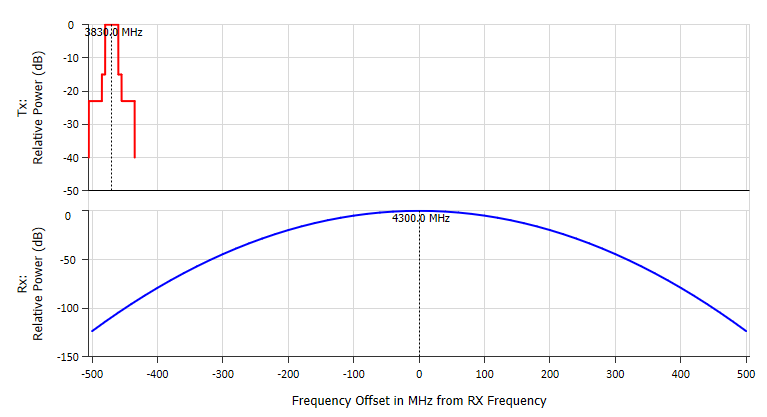
Interference from the 5G system into the radar altimeter is typically measured as power (dBm) or a power ratio (such as interference to noise in dB). This interfering power will depend upon:
- How the 5G system’s power varies in the frequency domain, namely the transmit spectrum mask.
- How the radar altimeter’s receiver filters power in the frequency domain, namely the receive filter mask. In this case the receiver bandwidth was taken as 200 MHz.
- The difference in frequency between the 5G system and the radar altimeter.
An example is shown in the figure below:
There are different ways to model this, including:
- Model just the 5G interfering power in the victim receiver bandwidth or within a reference bandwidth such as 1 MHz.
- Model the full transmit spectrum mask of the 5G system and integrate with the receiver filter mask of the radar altimeter assuming constant power at the BS and UE
- Model the full transmit spectrum mask of the 5G system and integrate with the receiver filter mask of the radar altimeter including the use of power control by the UE.
Propagation Model
Radio waves propagate through an atmosphere that is continually changing, resulting in variations in received interfering signal strength. This is often modelled in a propagation model by an input parameter that defines the percentage of time for which the propagation loss will be at least the value calculated.
The simplest propagation model would be to just use free space path loss. But for this scenario, another propagation model could be the one in Recommendation ITU-R P.528 which is designed for ground to air paths and includes a percentage of time as an input, as shown in the figure below:
With large numbers of interferer signals there are options as to how to include this in the model, such as:
- Set all percentages of time in the propagation model to the same value, for example 1%.
- Set all percentages of time in the propagation model to different values, selected at random for each path for each time step.
- Set all percentages of time in the propagation model to the same value but selected at random and different at each time step.
The last of these is an example of propagation correlation, which models how radio paths from a given location are likely to experience similar atmospheric affects. This is only applicable if the atmospheric conditions are similar for all paths – for example, if all are within the same rain cell. This is unlikely to be the case for cases where propagation is dominated by multi-path reflections.
Another factor that could influence the interfering signals propagation is clutter. 5G base stations are likely located in built up areas where there are likely to be buildings that could obstruct the path to the aircraft. This could be modelled using the ground to air/space model in Recommendation ITU-R P.2108.
Impact of Level of Detail
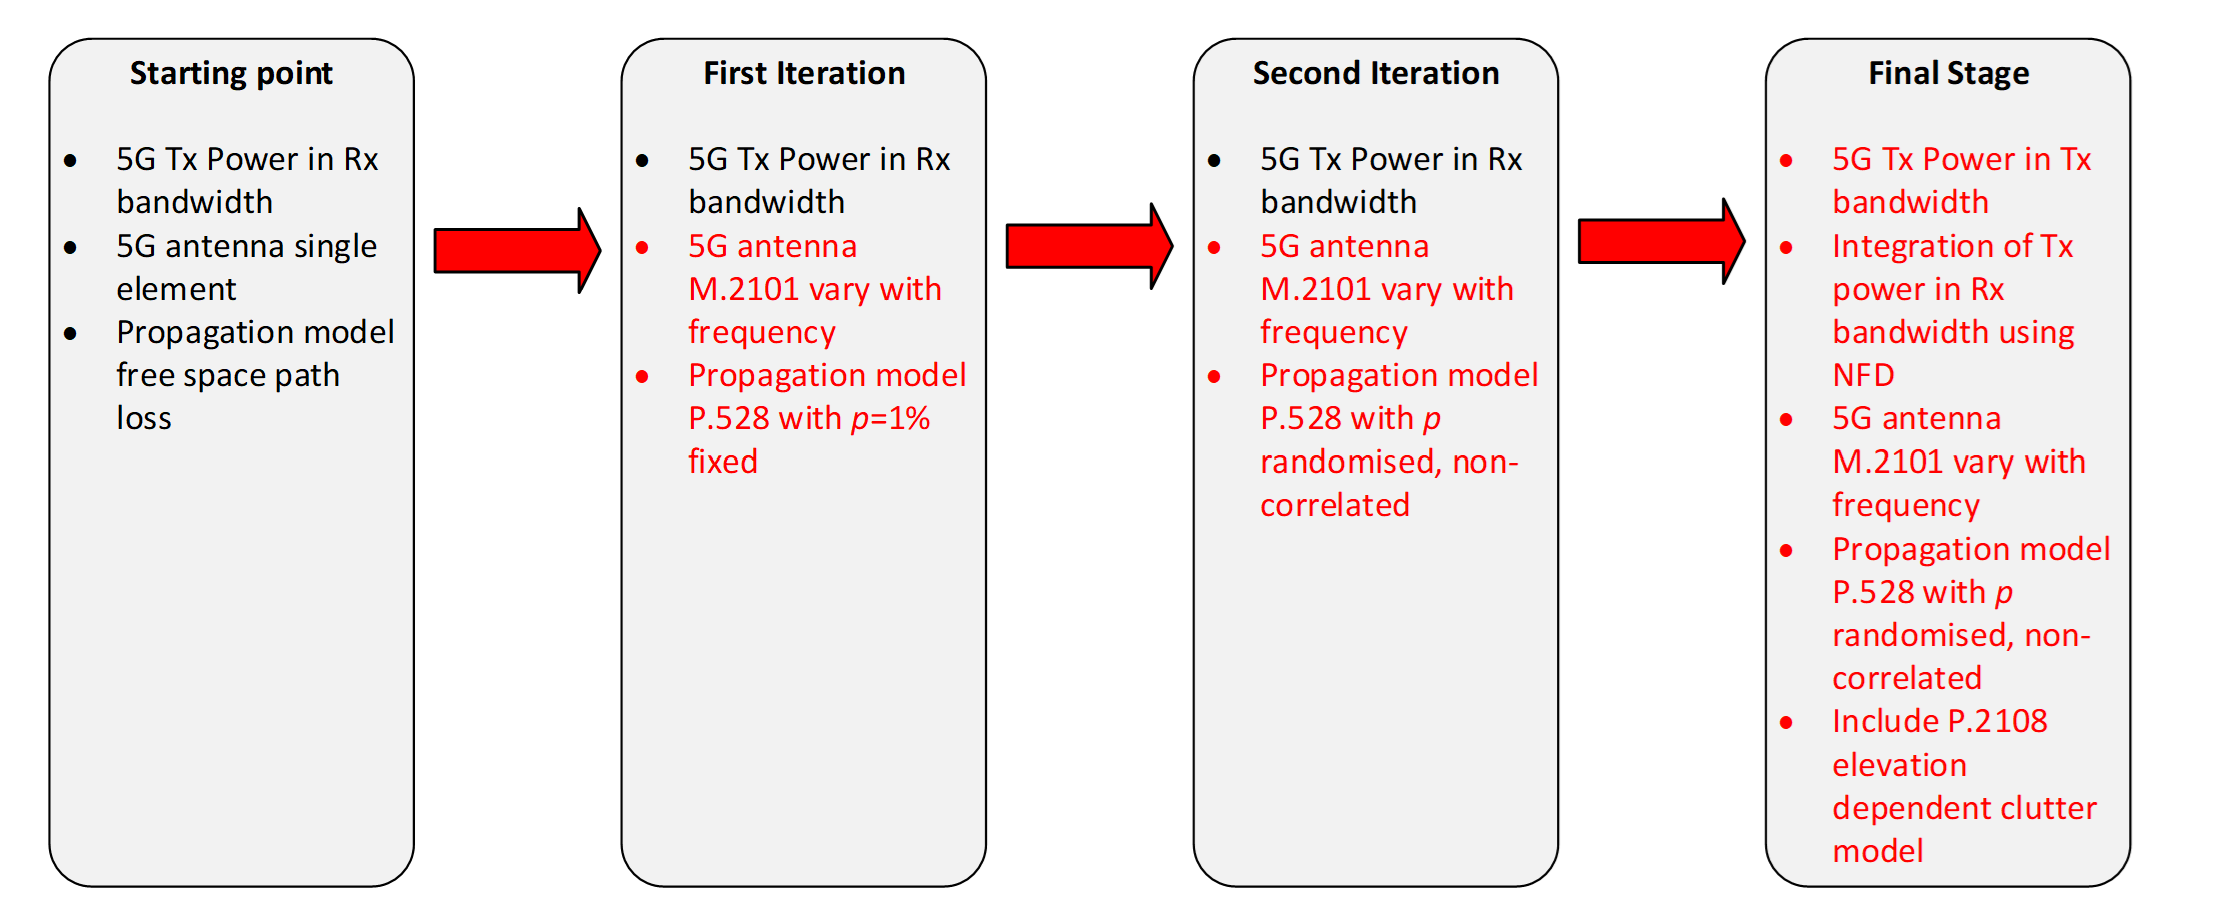
Cases Considered
To determine the impact of the level of modelling on the predicted interference levels, a series of simulations was created in Visualyse Professional starting from basic assumptions and moving to more detailed assessments as in the figure below:
In each case the following was calculated:
- The highest level of interference per MHz at the radar altimeter receiver
- The likelihood that a threshold of -117 dBm/MHz = -147 dBW/MHz at the radar altimeter receiver was exceeded. For the case that the interference was integrated over the transmit/receive masks, the threshold was modified to -94 dBm/200 MHz = -124 dBW/200 MHz.
Simulation File
The figure below shows a screenshot of the final stage simulation.
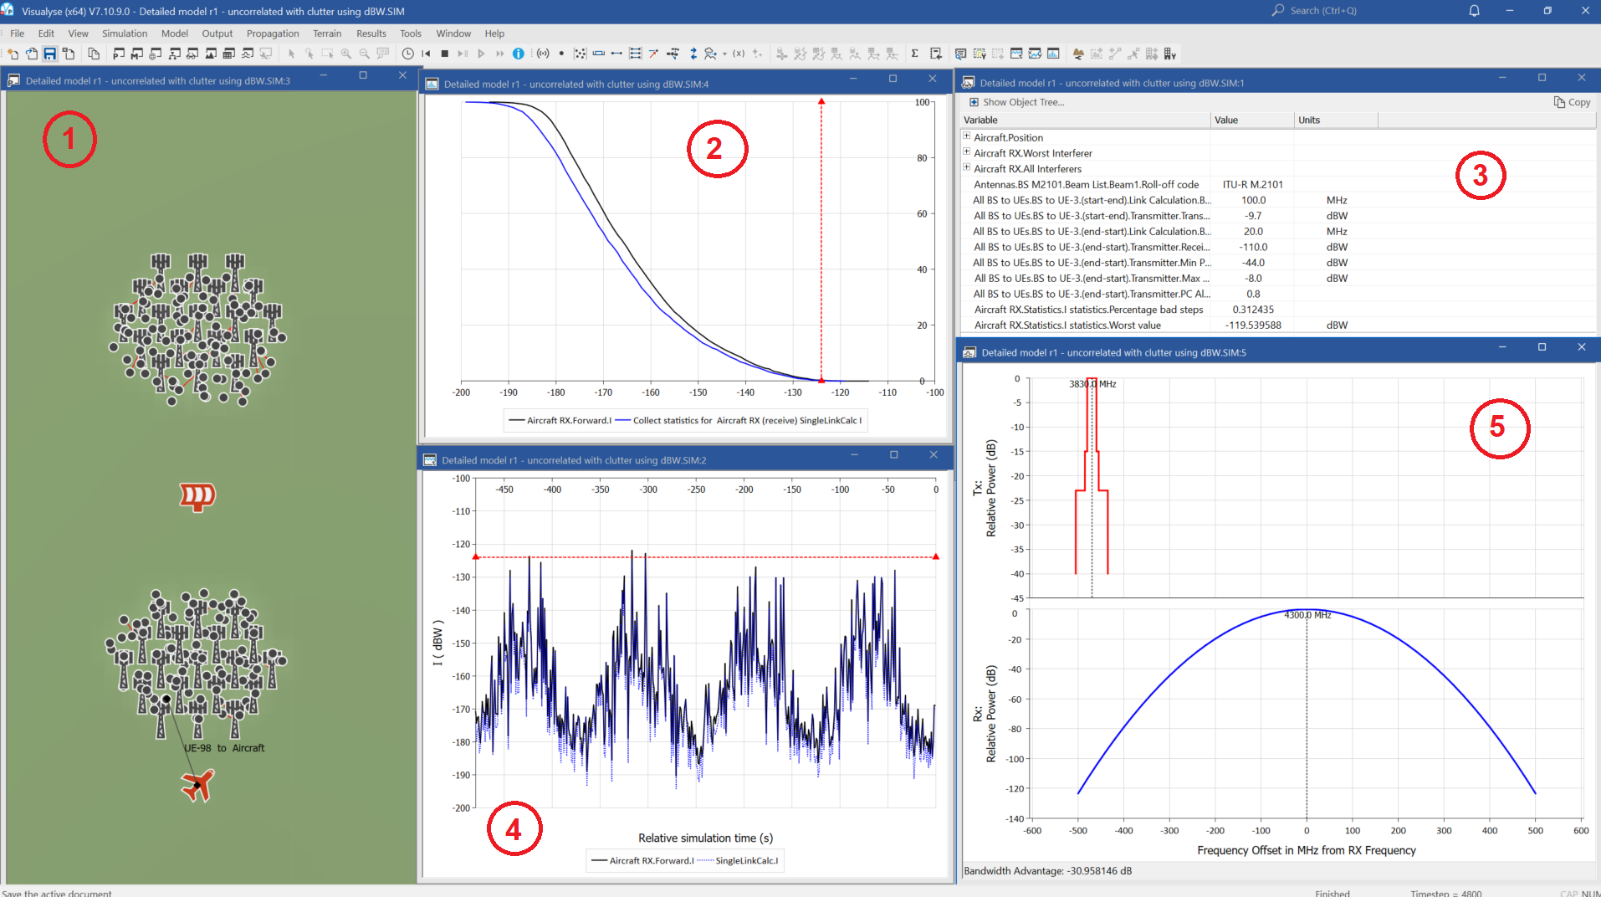
The screenshot shows the simulation with the following views open:
- Map view showing the deployment of the 5G system with BS and UEs plus the aircraft flying on approach to the airport.
- Chart showing the cumulative distribution function (CDF) of interference at the radar altimeter receiver and red line showing the interference threshold. The black line is the aggregate interference, the blue line represents the CDF of the worst single entry interferer.
- Watch window showing key parameters of the simulation including BS gain pattern (M.2101), powers, bandwidths and propagation model parameters.
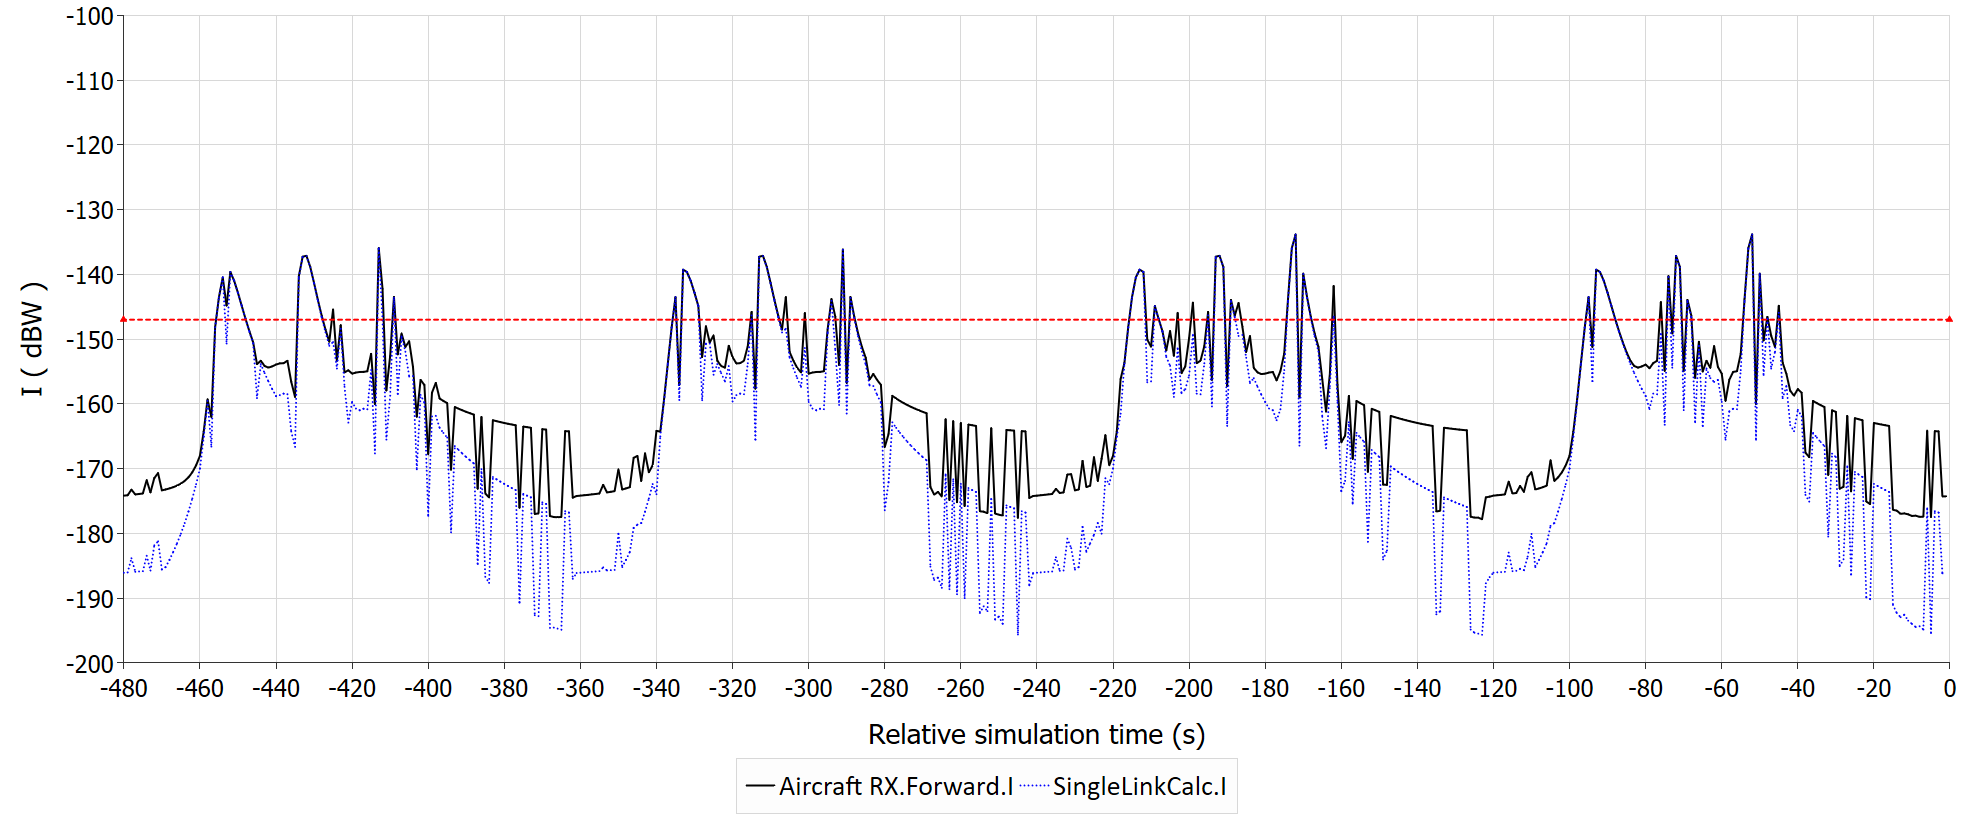
- Chart showing the variation in interference at the radar altimeter receiver against time with red line showing the interference threshold for the wider bandwidth of 200 MHz. As for window 2, the black line is the aggregate interference while the blue line is the worst single entry interferer.
- Frequency view showing the 5G transmit spectrum mask of the worst interferer in red and the radar altimeter receiver filter mask in blue.
It can be seen from the chart in window 4 that there is significant variation in the interference at the radar altimeter receiver against time. This is to be expected given the number of parameters that vary in a detailed assessment of interference for this scenario. A simplified approach could see less of a variation, as in the figure below:
Impact on Results
For the various cases considered, the interference metrics of highest interfering signal level and likelihood of threshold being exceeded are shown in the figure below:
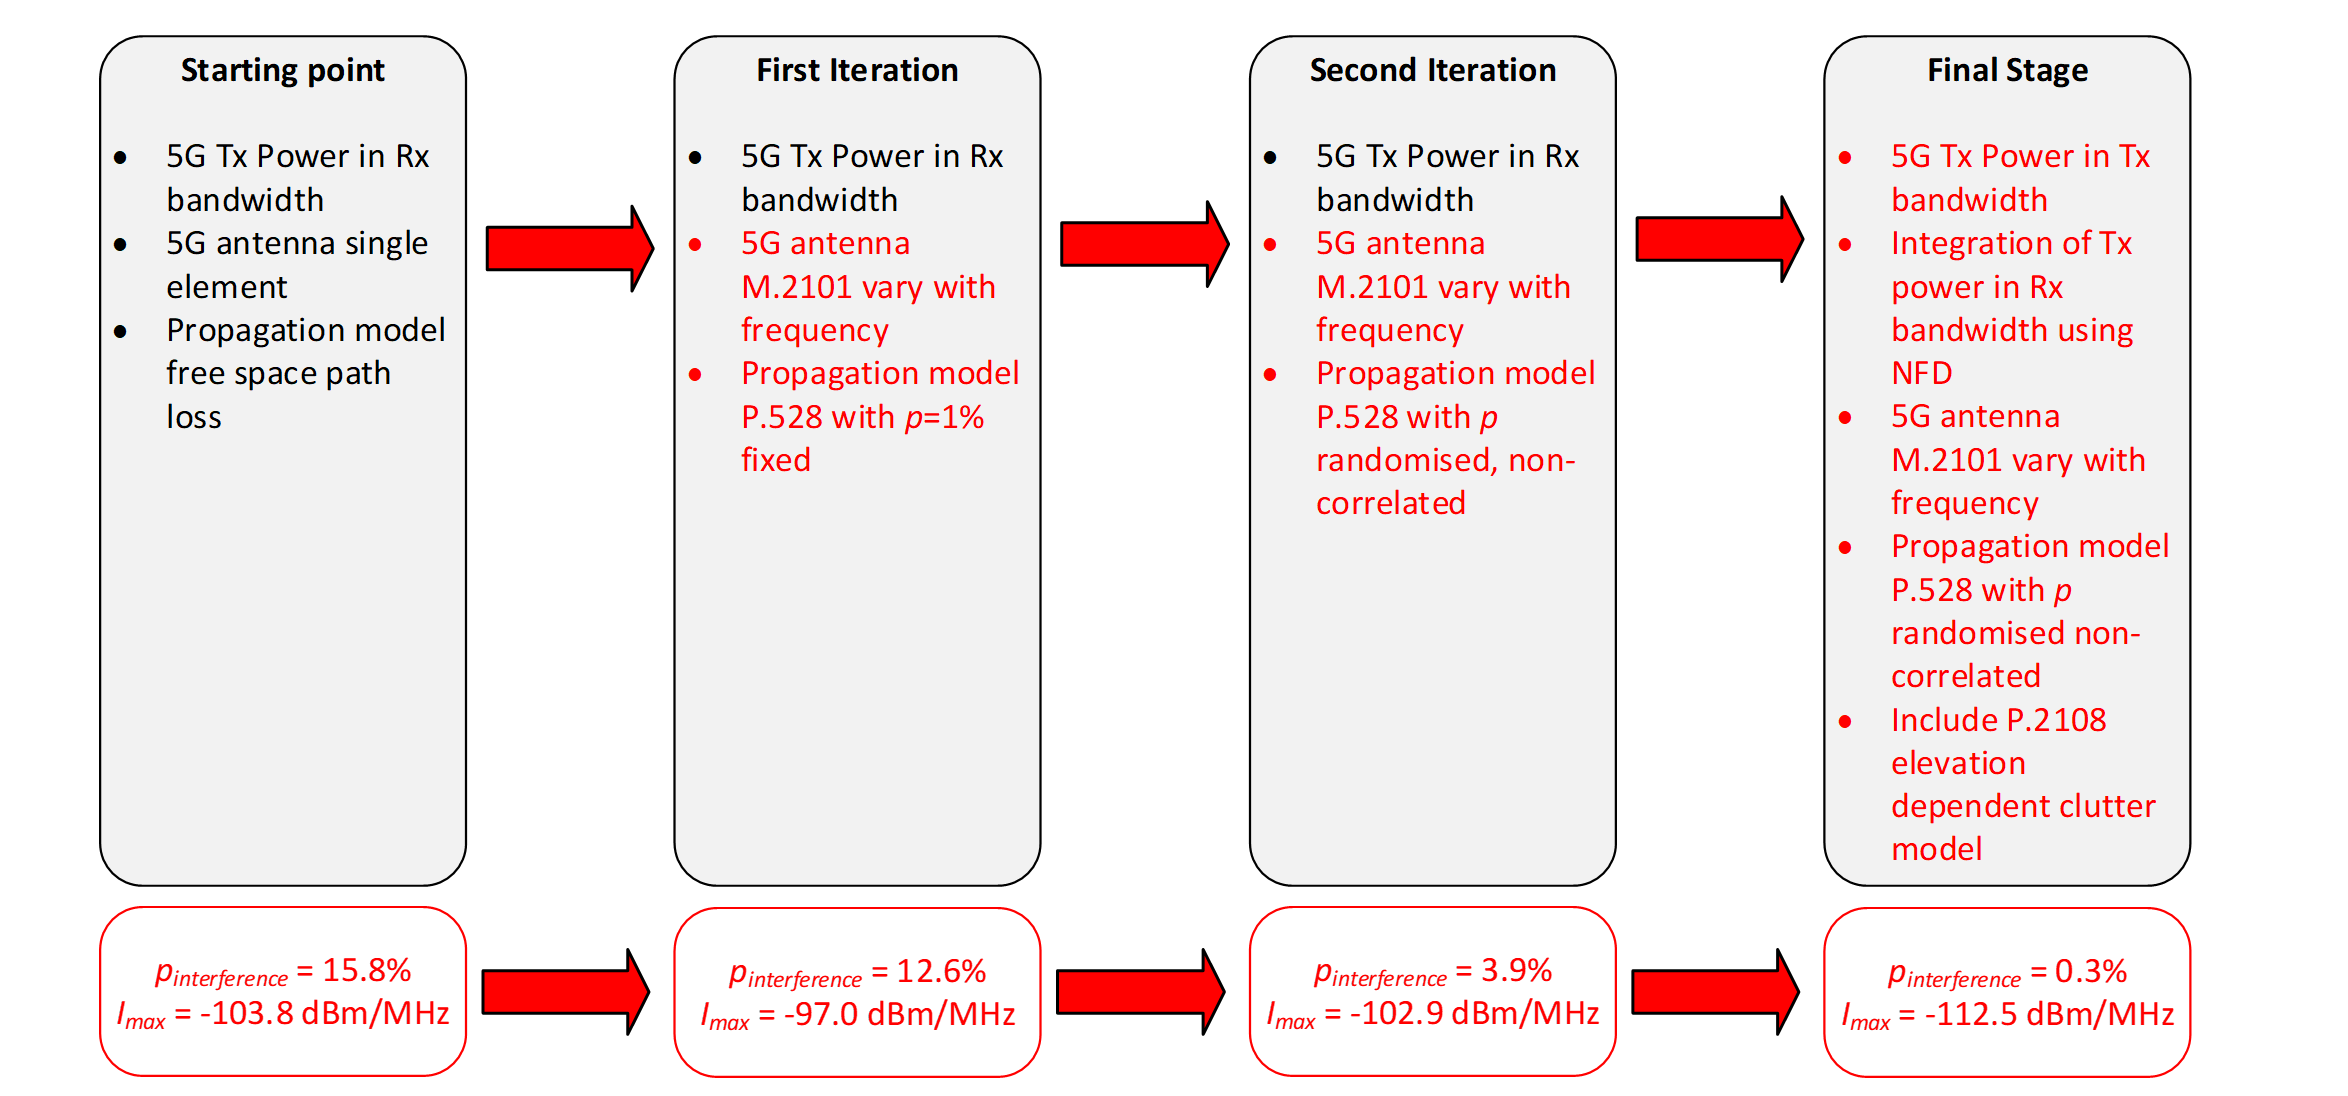
As the level of detail in modelling increases:
- The likelihood of interference reduces from 15.8% to 0.3%.
- Generally (but not always), the maximum level of interference decreases, in this case from -133.8 dBm/MHz to -142.5 dBm/MHz, or in dBm/MHz, decreases from -103.8 dBm/MHz to -112.5 dBm/MHz. Some of the increase in interference for the first and second iterations over the starting point could be due to the propagation loss within Recommendation P.528 being less than free space path loss for percentages of time less than 50%.
It is therefore very important that the simulation tool selected can model a variety of levels of detail such as those described above.
An example of a simulation tool that combines the flexibility, power and ease of use needed for these types of studies is the Visualyse Professional study tool described in the following section.
Visualyse Professional
Visualyse Professional is a flexible study tool able to model a very wide range of radiocommunications systems, that can be used to analyse system performance including the impact of interference. Visualyse Professional can model transmit and receive stations located at fixed positions, mobile stations, aircraft, ships and also satellite systems including Earth stations, geostationary orbit, GSO satellites, non-GSO satellites and highly eccentric orbit (HEO) satellites.
It can be configured to analyse spectrum sharing scenarios using a wide range of methodologies, including static, input parameter variation, area, dynamic, Monte Carlo and combinations such as area Monte Carlo. Visualyse Professional calculates radio signal power and related metrics, such as:
- Wanted signal = C.
- Interfering signal = I.
- Ratios like C/I, C/N, C/(N+I) & I/N.
- Powers, power densities, PFD and EPFD.
- Availability and throughput statistics.
Visualyse Professional includes a wide range of advanced features to enable it to analyse both co-frequency and non-co-frequency scenarios, the impact of terrain or clutter, the impact of traffic and complex handover strategies between satellites. It can be configured to undertake a wide range of modelling methodologies, such as:
- Static.
- Input-variation and minimum coupling loss.
- Area.
- Dynamic.
- Monte Carlo.
It contains libraries of gain patterns, station dynamics, antenna pointing methods, propagation models and station selection rules. These features allow it to model anything from a 5G network to a non-GSO mega-constellations such as SpaceX’s Starlink.
Visualyse Professional is:
- Best in class product, being the leading tool for radiocommunication modelling and interference analysis.
- Widely used, within fora such as the ITU-R, it is the most commonly used radiocommunication simulator tool.
- Trusted world-wide, by government agencies, regulators, satellite operators and terrestrial operators with hundreds of copies and sites.
- Extensively tested, compared against other tools, and in-house test suites.
- Fully supported, including technical support, maintenance, and training.
- Fully featured, able to model anything from 5G systems to mega-constellations.
- Continually developed, with new features continually being released.
Visualyse Professional is developed and marketed by Transfinite Systems Ltd described in the following section.
About Transfinite
We are one of the leading consultancy and simulation software companies in the field of radiocommunications. We develop and market the leading Visualyse products:
- Visualyse Professional, as described above.
- Visualyse Interplanetary.
- Visualyse GSO.
- Visualyse EPFD and associated Visualyse PMGT (PFD Mask Generator Tool)
Contact Us
More information about these products and services is available at our web site:
If you have any questions or comments about this Newsletter or would like more information, please do not hesitate to contact us at: