
4
Mar
Introduction
Radio communication systems can use adaptive coding and modulation (ACM) to adapt to changing link conditions. This enables the link to continue to be available with the highest data rate feasible for the given C/N or C/(N+I). Examples of use of ACM include within Wi-Fi and 5G mobile networks.
ACM is also used by satellite systems, including the DVB-S2X standard. This was used to develop Recommendation ITU-R S.2131 “Method for the determination of performance objectives for satellite hypothetical reference digital paths using adaptive coding and modulation”. In particular, it gives equations that can be used to calculate the spectrum efficiency (SE) of a link in bits/second given an input C/N or C/(N+I) in dB.
A number of plots can be generated as shown below that take account of:
- There are two versions of the Recommendation, namely S.2131-0 and S.2131-1.
- These Recommendations give two curves, one for average spectrum efficiency and another for minimum spectrum efficiency
- Recommendation ITU-R S.2131-1 also gives an additional curve for systems that can process low C/Ns

The plot above uses the equations in Rec. ITU-R S.2131 to derive the spectrum efficiency in bits/s/Hertz. The total spectrum efficiency of the carrier can then be calculated by taking into account the bandwidth in Hertz, BW, as in:
Where:
spectrum efficiency in bits/s/Hz
BW = bandwidth in Hz
SE = spectrum efficiency in bits/s
The total throughput (TTP) over a simulation can be calculated using the following summation:
Where:
number of time steps
spectrum efficiency for the i-th time step in bits/s
time step in seconds
The average throughput (ATP) is then:
One of the metrics used in interference analysis is the percentage decrease in the ATP due to interference i.e.
Note that in a typical run the number of time steps and time step size are the same for both the calculation of and , and hence this is the same as:
An example of where this metric is used can be found in the analysis methodology of Resolution 770 as defined in Rec. ITU-R S.2157.
Implementation in Visualyse Professional
Visualyse Professional includes the ability to calculate throughput using the equations in Rec. ITU-R S.2131 or using a table of {C/N, SE}. The options can be selected using the Carrier dialog:
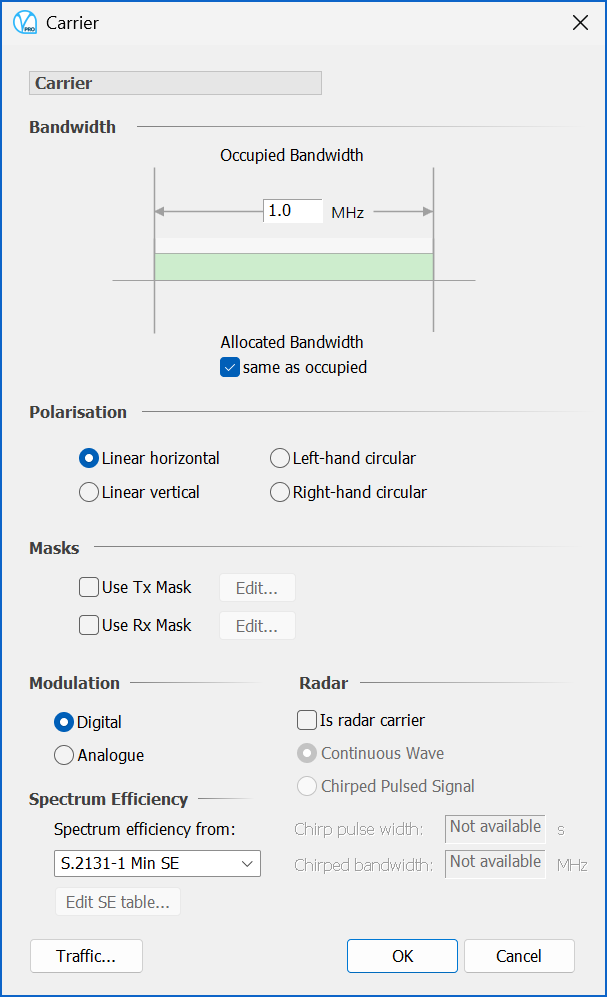
The calculation of spectrum efficiency is only available for Carriers using digital modulation.
The drop-down list gave the spectrum efficiency options as:
- S.2131-0
- S.2131-0 Minimum spectrum efficiency
- S.2131-1
- S.2131-1 Minimum spectrum efficiency
- S.2131-1 Minimum spectrum efficiency (low)
- Table.
The SE and the TTP are visible in the Link Status dialog or can be shown in the Watch Window as follows:
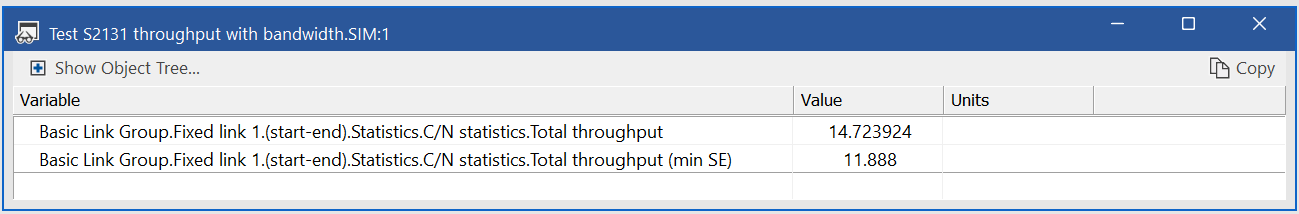
Note that in this case the “Min SE” field and “Total throughput (min SE)” are not used.
From the TTP field for the C/N and C/(N+I) statistics, the percentage decrease in the ATP can be calculated using the equation above.
By default, the spectrum efficiency options are specified in the Carrier object, but there is also an option under the Statistics | Calculations Options dialog:
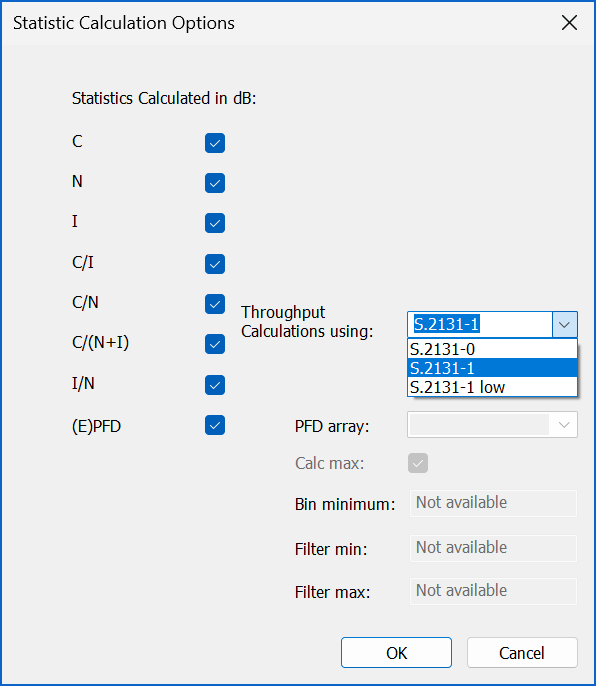
This approach is limited to just the Rec. ITU-R S.2131 options, not the table, but allows the calculation of both SE and Min SE at each time step.
Link Groups
Note that the throughput is also calculated in the Link Groups using the following rules:
| Method | Rule |
|---|---|
| Best link | Uses the link with the highest C/N |
| Best link by | Uses the link with the best metric |
| Worst link | Uses the link with the lowest C/N |
| Worst link by | Uses the link with the worst metric |
| Thermal addition | Uses the bandwidth of the last link with the C/N or C/(N+I) calculated using thermal addition |
| Maximum power combining | Uses the bandwidth of the last link with the C/N or C/(N+I) calculated using maximum power combining |
The All Links statistics calculates the total SE and TTP over all Links in the Link Group.